 Stay
Stay 
Trading Conditions
Products
Tools

The index managed to make a retracement from the Monday's highs, but the 200 SMA remains as a dynamic support in the short-term, where also it has formed a fractal. We should remind that a breakout above 94.10 can open the doors for a testing of the 94.88 level. However, a breakout below the 200 SMA on H1 chart should strengthen the bearish bias.
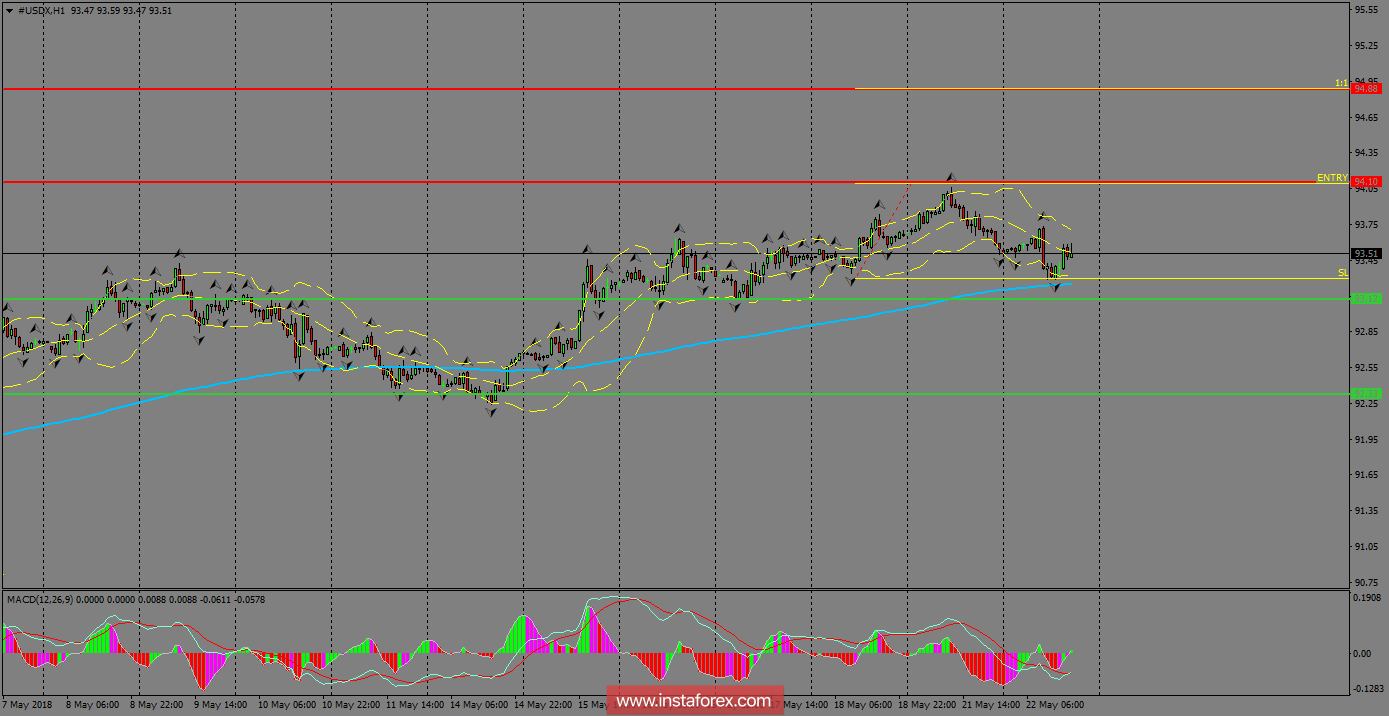
H1 chart's resistance levels: 94.10 / 94.88
H1 chart's support levels: 93.12 / 92.33
Trading recommendations for today: Based on the H1 chart, place buy (long) orders only if the USD Index breaks with a bearish candlestick; the support level is at 94.10, take profit is at 94.88 and stop loss is at 93.30.InstaForex analytical reviews will make you fully aware of market trends! Being an InstaForex client, you are provided with a large number of free services for efficient trading.


