 Stay
Stay 
Trading Conditions
Products
Tools


When analyzing the wave structure of the major pair US Dollar and Swiss franc on a large scale of the chart, an upward wave zigzag is shown. The first two parts of the wave (A; B) are already fully formed.
In mid-February, the price increased with a high wave potential, exceeding the level of the pullback in the previous decline. By the current day, it can be said that the bullish wave will eventually give rise to a new short-term trend. Until the end of this month, you can wait for the formation of the counter correction graph. The expected lower boundary of the expected decline is within the framework of the calculated support zone. Furthermore, the growth of pair's price is expected to continue.
Boundaries of resistance zones:
- 0.9800 / 0.9850
Boundaries of support zones:
- 0.9520 / 0.9470
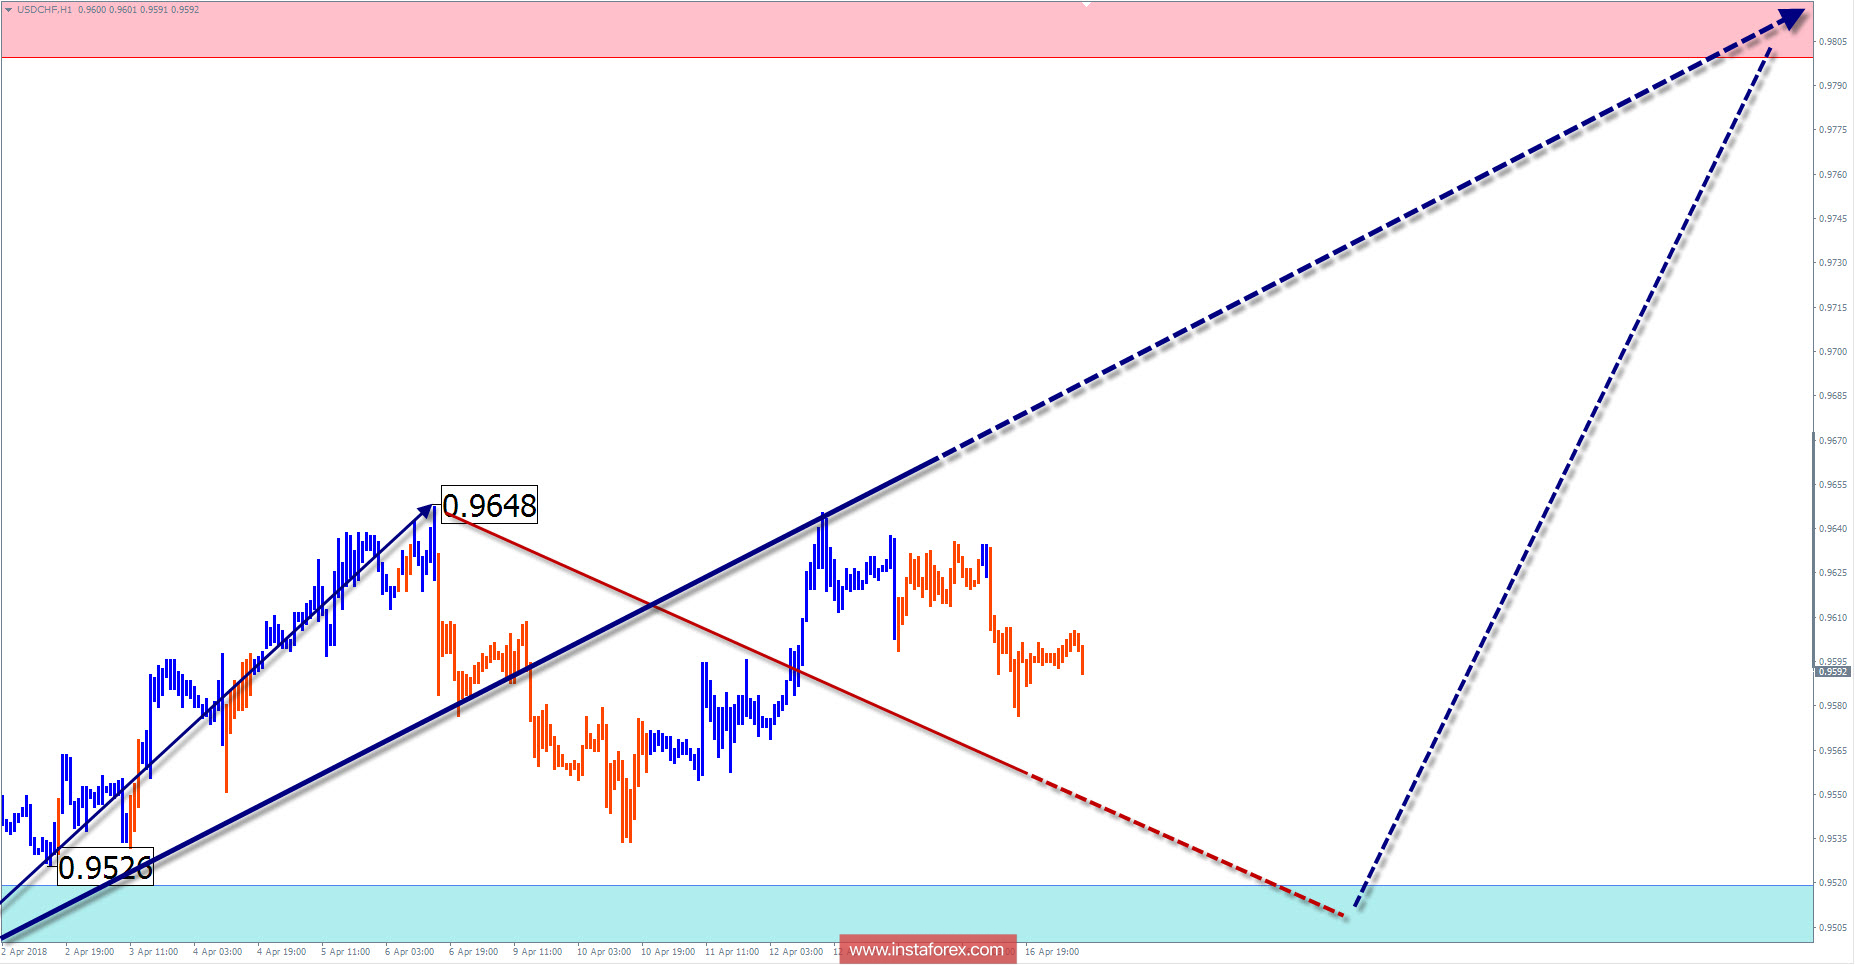
Explanations to the figures: For simplified wave analysis, the simplest type of wave is used in the form of a zigzag, combining 3 parts (A; B; C). Of these waves, all kinds of correction are composed and most of the impulses. At each time frame, the last, incomplete wave is analyzed.
The areas marked on the graphs are indicated by the calculation areas, where the probability of a change in the direction of motion is significantly increased. Arrows indicate the wave counting according to the technique used by the author. The solid background of the arrows indicates the structure formed, the dotted one indicates the expected wave motion.
Attention: The wave algorithm does not take into account the duration of the tool movements in time. The forecast is not a trading signal! To conduct a trade transaction, you need to confirm the signals of your trading systems.
* The presented market analysis is informative and does not constitute a guide to the transaction.
InstaForex analytical reviews will make you fully aware of market trends! Being an InstaForex client, you are provided with a large number of free services for efficient trading.


