 Stay
Stay 
Trading Conditions
Products
Tools


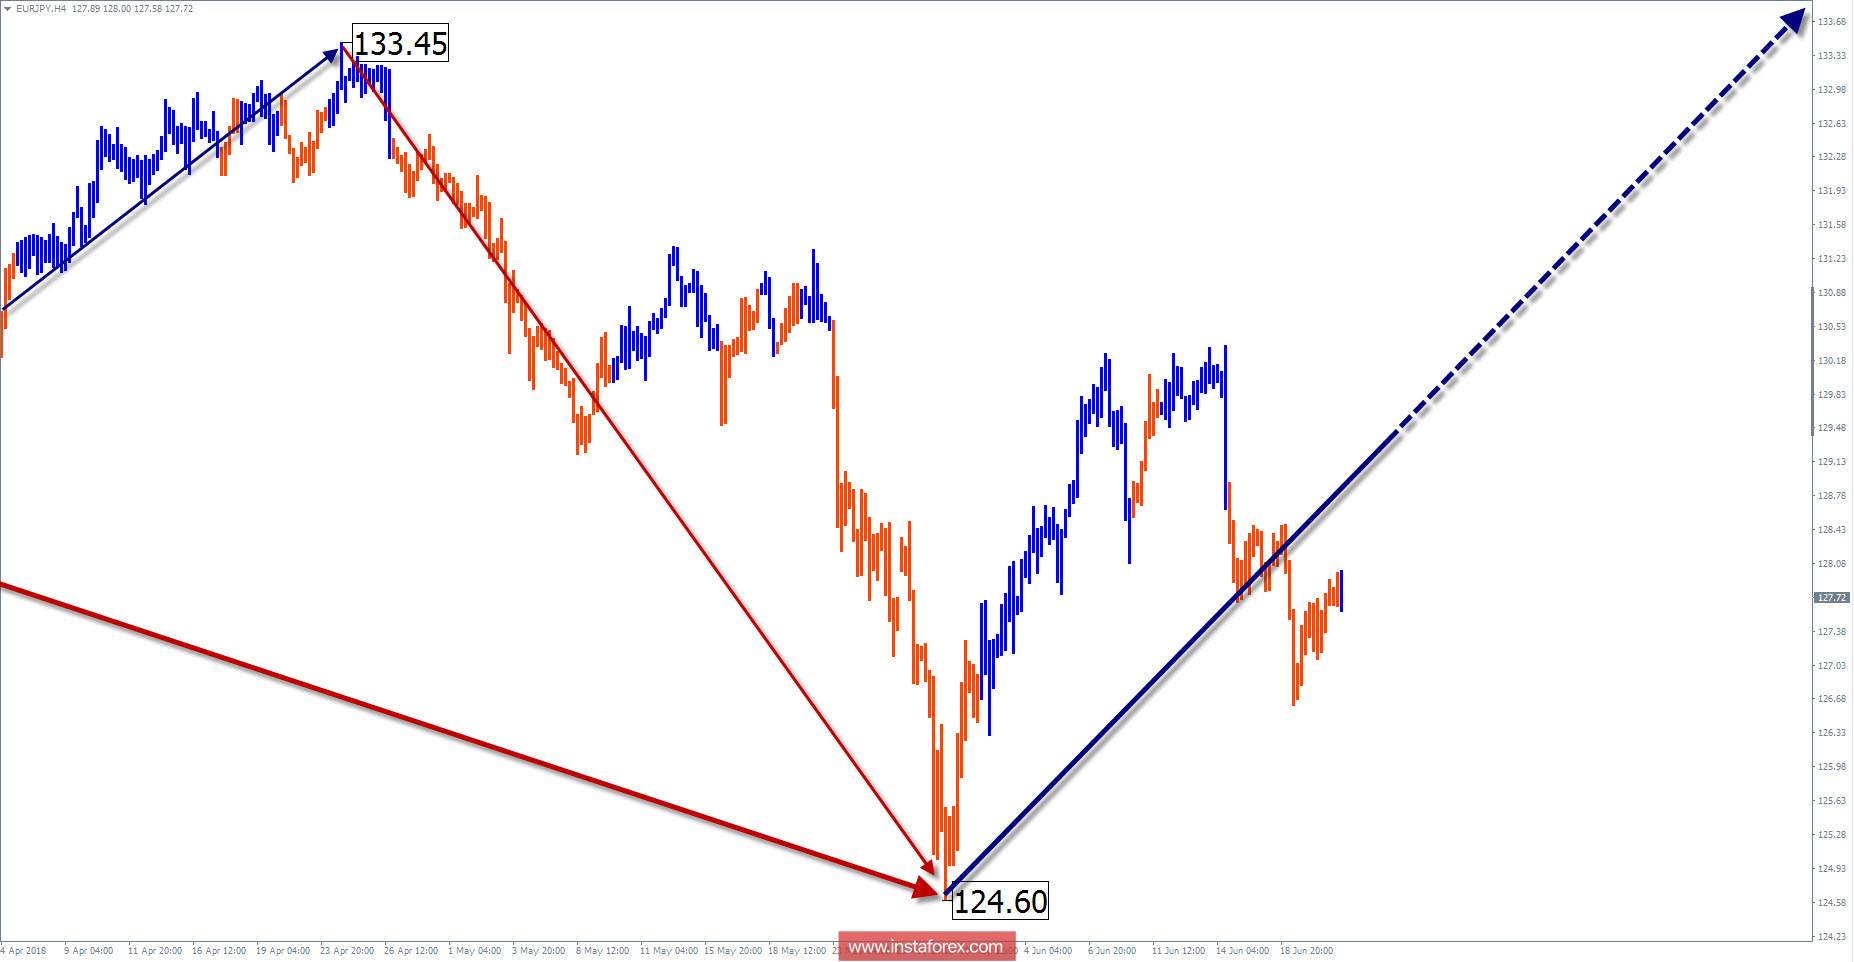
The wave pattern of the H4 graph:
The direction of the main movement this year from February 2 sets the downward wave. In a larger wave design, the area turn into a correction. The preliminary goal of the wave has been reached and the structure has been fully formed.
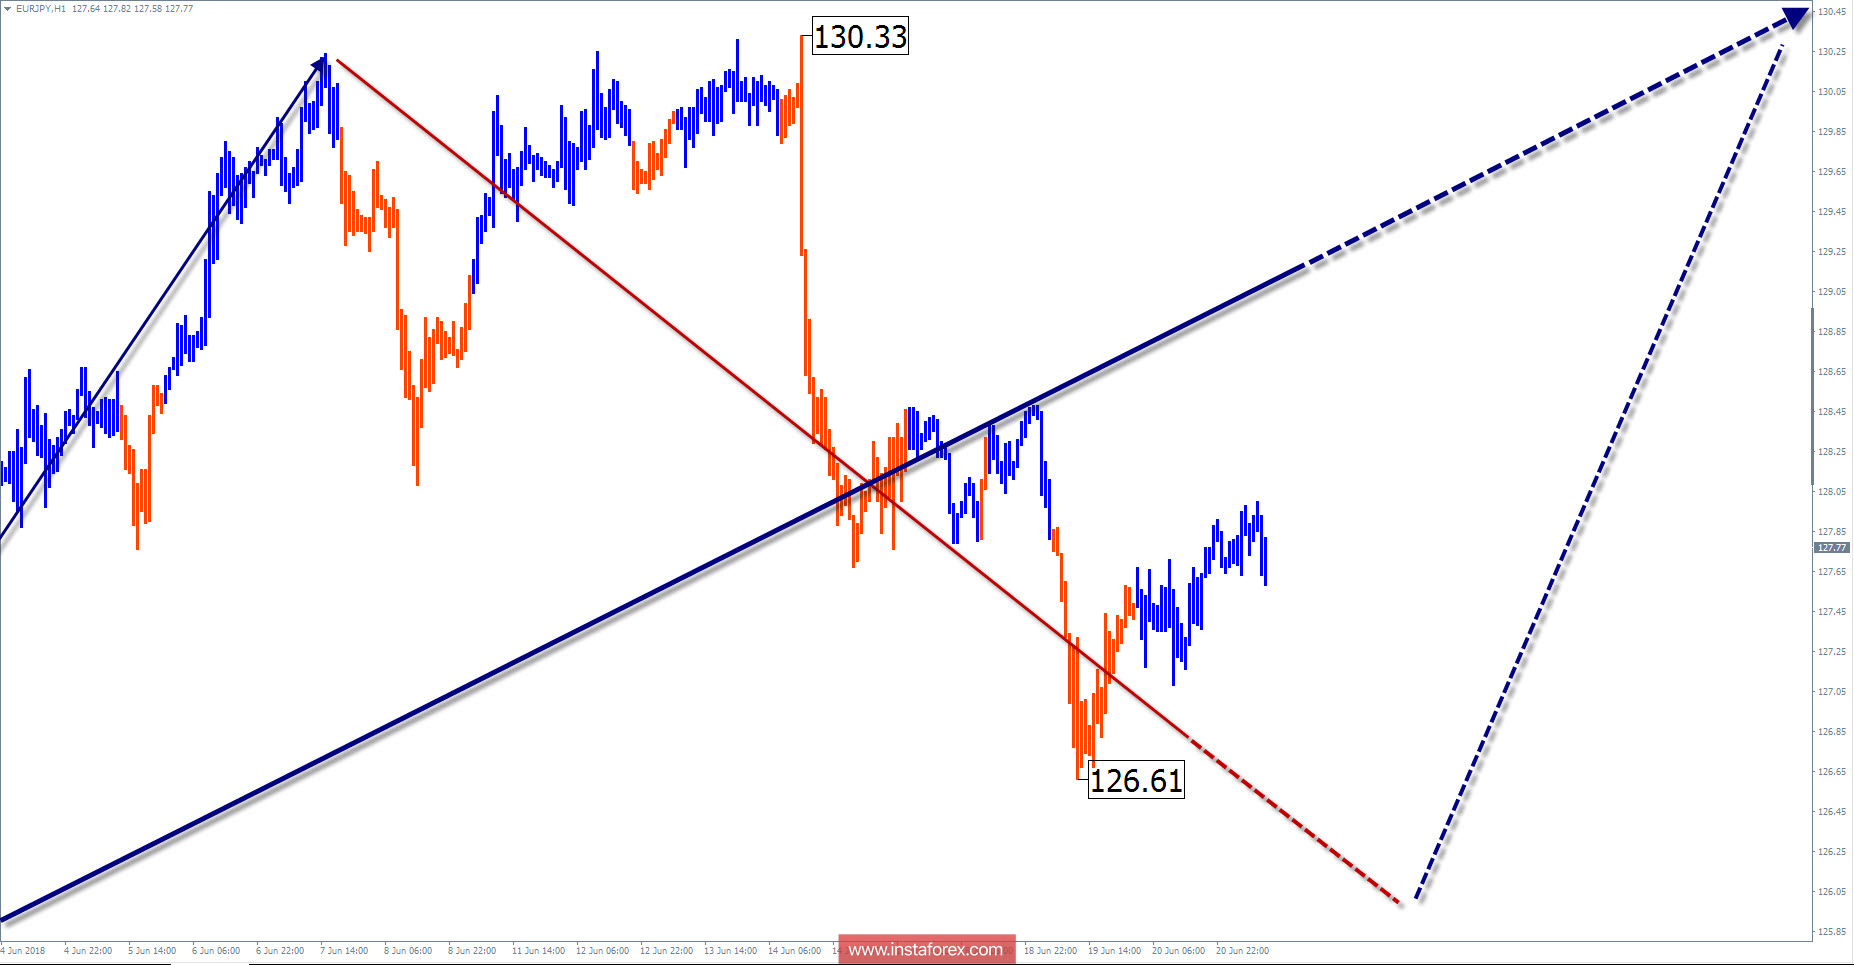
The wave pattern of the H1 graph:
The ascending wave from May 29 is closest to this scale of analysis. It has a high wave level, with the prospect of moving to a larger scale of motion. The price forms a downward rollback in the whole current month.
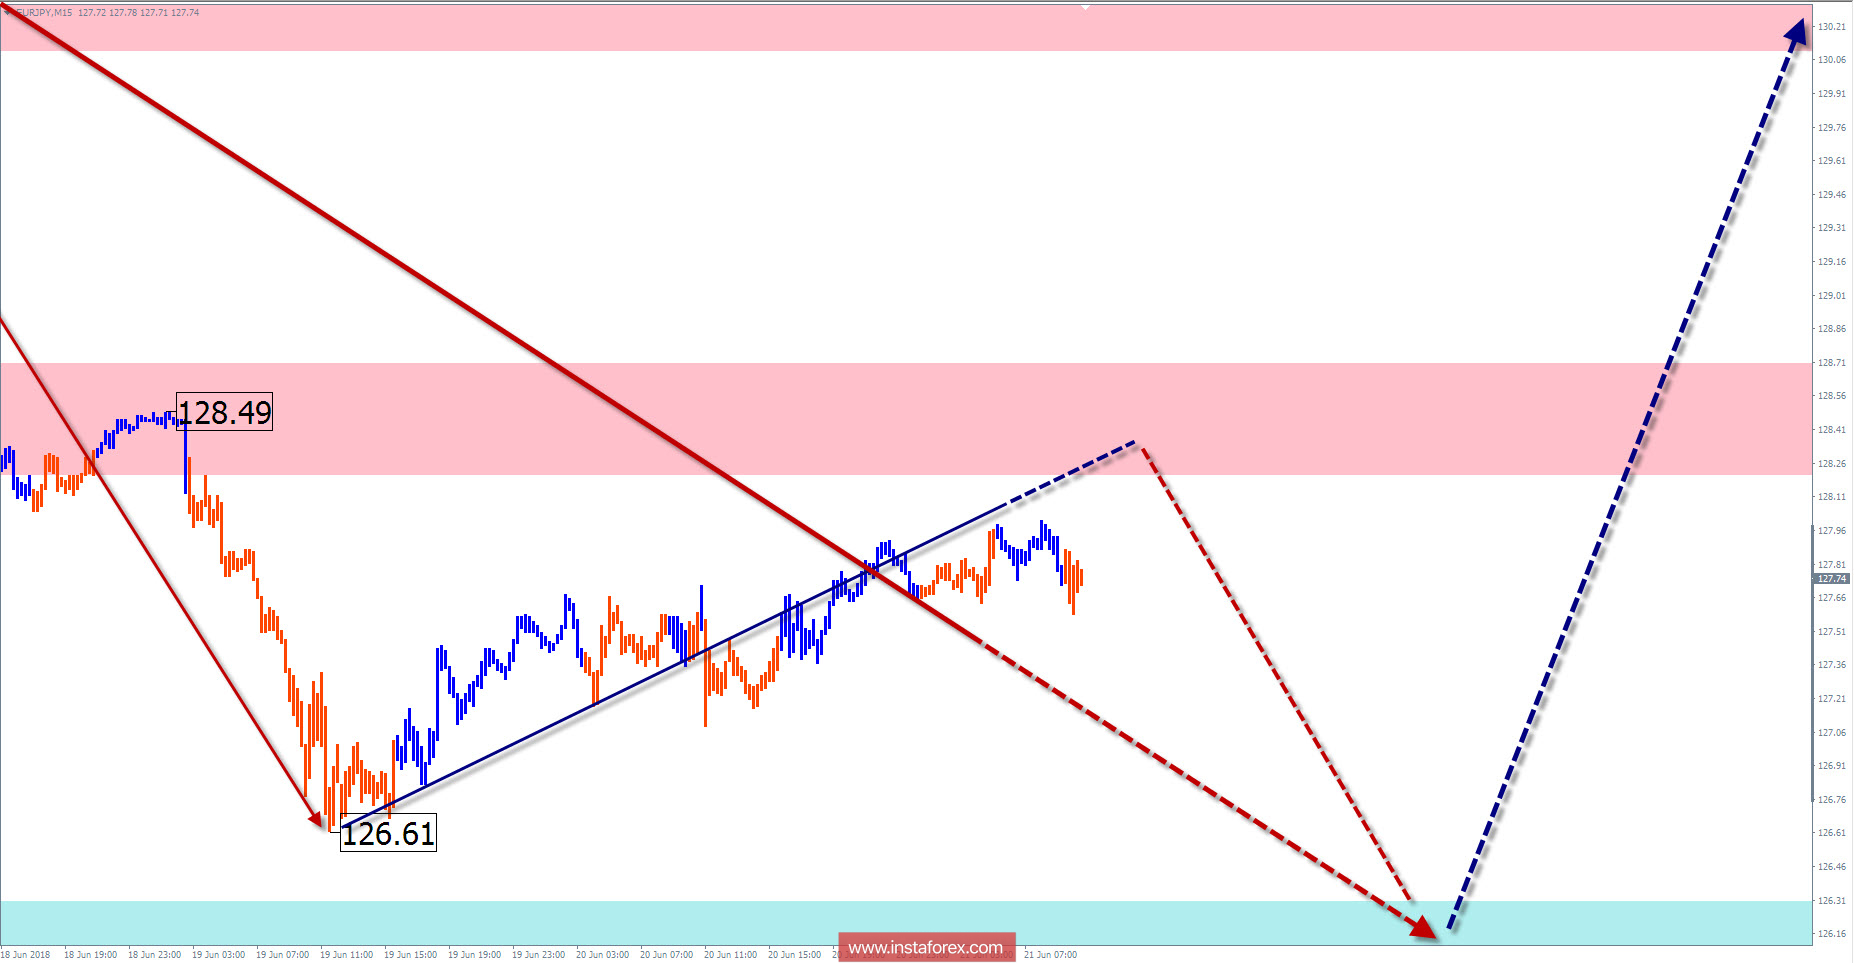
The wave pattern of the M15 chart:
The bearish wave of June 7 in a larger wave model forms the middle part (B). The estimated level of completion is within the support zone.
Recommended trading strategy:
Sales have a small potential and it can only be used for intraday trading. To trade on higher timeframes, you need to track buy signals.
Resistance zones:
- 130.10 / 130.60
- 128.20 / 128.70
Support zones:
- 126.30 / 125.80
Explanations to the figures:
A simplified wave analysis uses a simple waveform, in the form of a 3-part zigzag (ABC). The last incomplete wave for every timeframe is analyzed. Zones show the calculated areas with the greatest probability of a turn.
Arrows indicate the counting of wave according to the technique used by the author. The solid background shows the generated structure and the dotted exhibits the expected wave motion.
Attention: The wave algorithm does not take into account the duration of the tool movements in time. To conduct a trade transaction, you need to confirm the signals used by your trading systems.
InstaForex analytical reviews will make you fully aware of market trends! Being an InstaForex client, you are provided with a large number of free services for efficient trading.


