 Stay
Stay 
Trading Conditions
Products
Tools


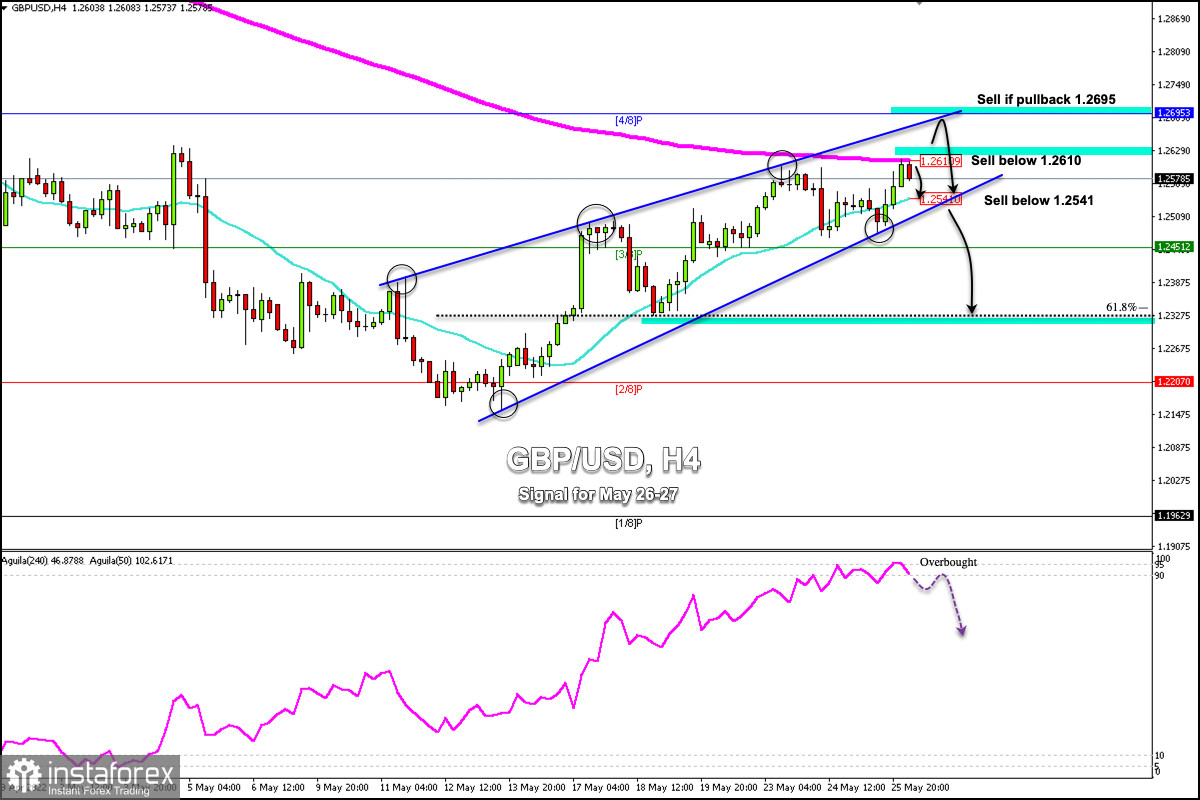
Early in the Asian session, the British pound reached the 200 EMA located at 1.2610. GBP/USD is currently trading below this moving average and is showing overbought levels. So, a technical correction is likely to occur in the next few hours.
According to the 4-hour chart, we can see the formation of a bullish wedge. This pattern could offer a bearish signal if the pound breaks the 21 SMA located at 1.2541.
On the other hand, a pullback towards 4/8 Murray (1.2635) will serve as strong resistance for the British pound, which will cause an imminent correction so that the price could reach the level of 1.2450.
GBP/USD has a bearish bias as long as it trades below the 200 EMA and below the 4/8 Murray. There is solid resistance at 1.2695. In case of a break and a daily close above this level, it could mean an advance and the pair could reach the psychological level of 1.3000.
This barrier of 4/8 Murray will be difficult for the British pound bulls to break, but if it breaks 1.27, the pair could retest the zone 1.3000 in the short term.
Otherwise, a break below 1.2440 would expose the pair to further selling pressure which could lead to a retest of lows around 61.8% Fibonacci and even a fall to 2/8 Murray at 1.2207.
The Eagle indicator has reached the 95-point zone, which represents extremely oversold levels. Our trading plan for the next few hours is to sell below 1.2610 (200 EMA), with targets at 1.2540 and at 1.2351 (3/8). On the other hand, a pullback towards 1.2695 (4/8) will be an opportunity to sell, with targets at 1.2610, 1.2541 and 1.2375 (61.8% Fibonacci).
InstaForex analytical reviews will make you fully aware of market trends! Being an InstaForex client, you are provided with a large number of free services for efficient trading.

