empty
 
 
You are about to leave
www.instaforex.eu >
a website operated by
INSTANT TRADING EU LTD
Open Account

21.07.202214:55 Forex Analysis & Reviews: Bullish divergence in Gold 4 hour chart.

This information is provided to retail and professional clients as part of marketing communication. It does not contain and should not be construed as containing investment advice or investment recommendation or an offer or solicitation to engage in any transaction or strategy in financial instruments. Past performance is not a guarantee or prediction of future performance. Instant Trading EU Ltd. makes no representation and assumes no liability as to the accuracy or completeness of the information provided, or any loss arising from any investment based on analysis, forecast or other information provided by an employee of the Company or otherwise. Full disclaimer is available here.

Exchange Rates 21.07.2022 analysis

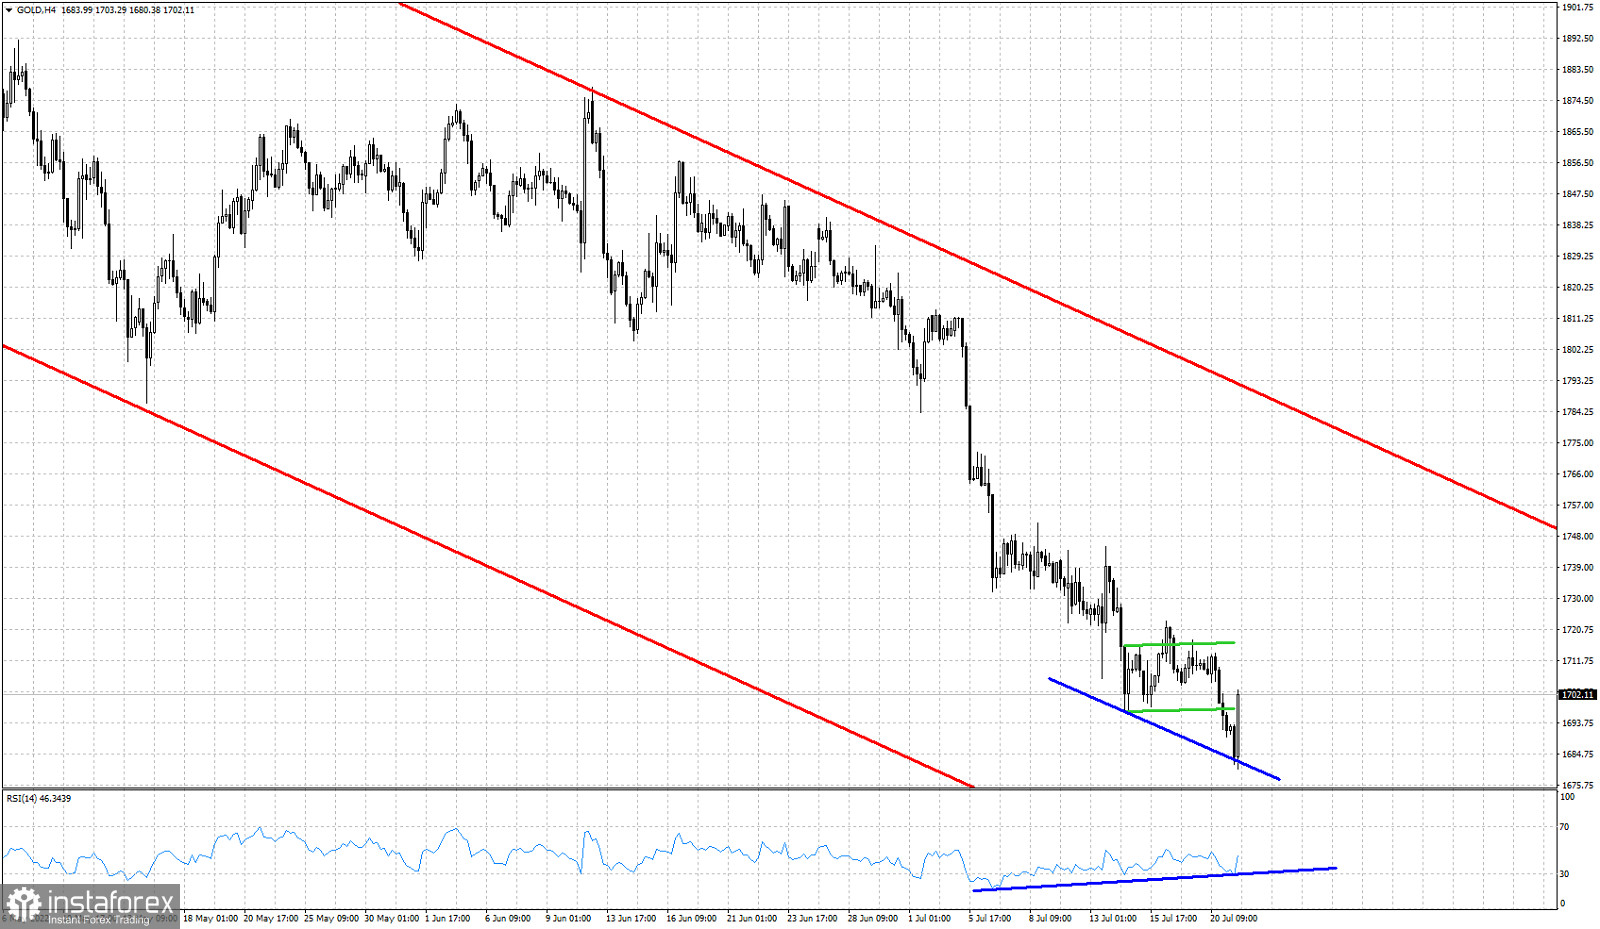
Red lines- bearish channel

Blue lines- bullish RSI divergence

Green lines- short-term trading range

Gold price earlier today broke below the short-term trading range it was in and pushed price below $1,700. As we mentioned in a previous analysis, a break of the trading range would bring Gold price below $1,700 towards $1,690 at least. Today Gold price made a new lower low at $1,680. Despite making a new lower low, the RSI did not follow and formed a higher low. This was a bullish divergence. Down trend is weakening. Gold price justifies a bounce higher. Although Gold remains inside the medium-term red bearish channel, price has potential to bounce towards $1,770.

Alexandros Yfantis
Analytical expert of InstaForex
© 2007-2026

Open trading account

InstaForex analytical reviews will make you fully aware of market trends! Being an InstaForex client, you are provided with a large number of free services for efficient trading.


You are now leaving www.instaforex.eu, a website operated by INSTANT TRADING EU LTD
Can't speak right now?
Ask your question in the chat.
Widget callback

Turn "Do Not Track" off