 Stay
Stay 
Trading Conditions
Products
Tools


Trend analysis (Fig. 1)
The price from the level of 1.3318 (closing of yesterday's daily candle) will make an attempt to start rising today to the target of 1.3352 – the historical resistance level (blue dotted line). After this level is tested, it may further rise to the target of 1.3383 – the pullback level of 50.0% (blue dotted line).
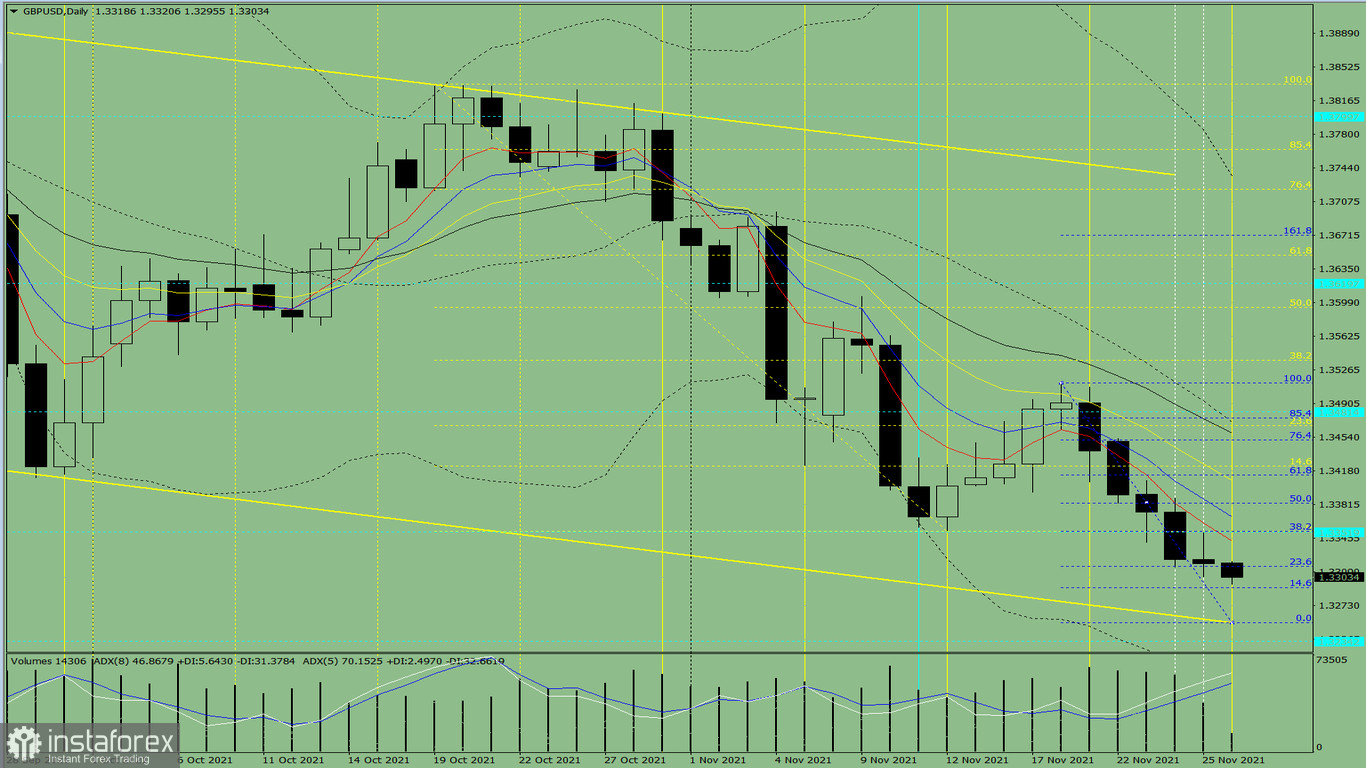
Figure 1 (daily chart)
Comprehensive analysis:
General conclusion:
Today, the price from the level of 1.3318 (closing of yesterday's daily candle) will try to start increasing to the target of 1.3352 – the historical resistance level (blue dotted line). After testing it, the upward movement may continue to the target of 1.3383 – the pullback level of 50.0% (blue dotted line).
Alternatively, the price from the level of 1.3318 (closing of yesterday's daily candle) will try to continue declining to the target of 1.3252 – the support line (yellow bold line). After testing this line, the price may start growing to the target of 1.3292 – the pullback level of 14.6% (blue dotted line).
InstaForex analytical reviews will make you fully aware of market trends! Being an InstaForex client, you are provided with a large number of free services for efficient trading.


