 Stay
Stay 
Trading Conditions
Products
Tools


Trend analysis (Fig. 1).
The market may move down on Tuesday from the level of 1.1296 (closing of yesterday's daily candle) to reach the support level of 1.1265 (blue bold line). If this level is tested, the price may move upward to the target level of 1.1306, the 23.6% retracement level (blue dotted line), and then further up.
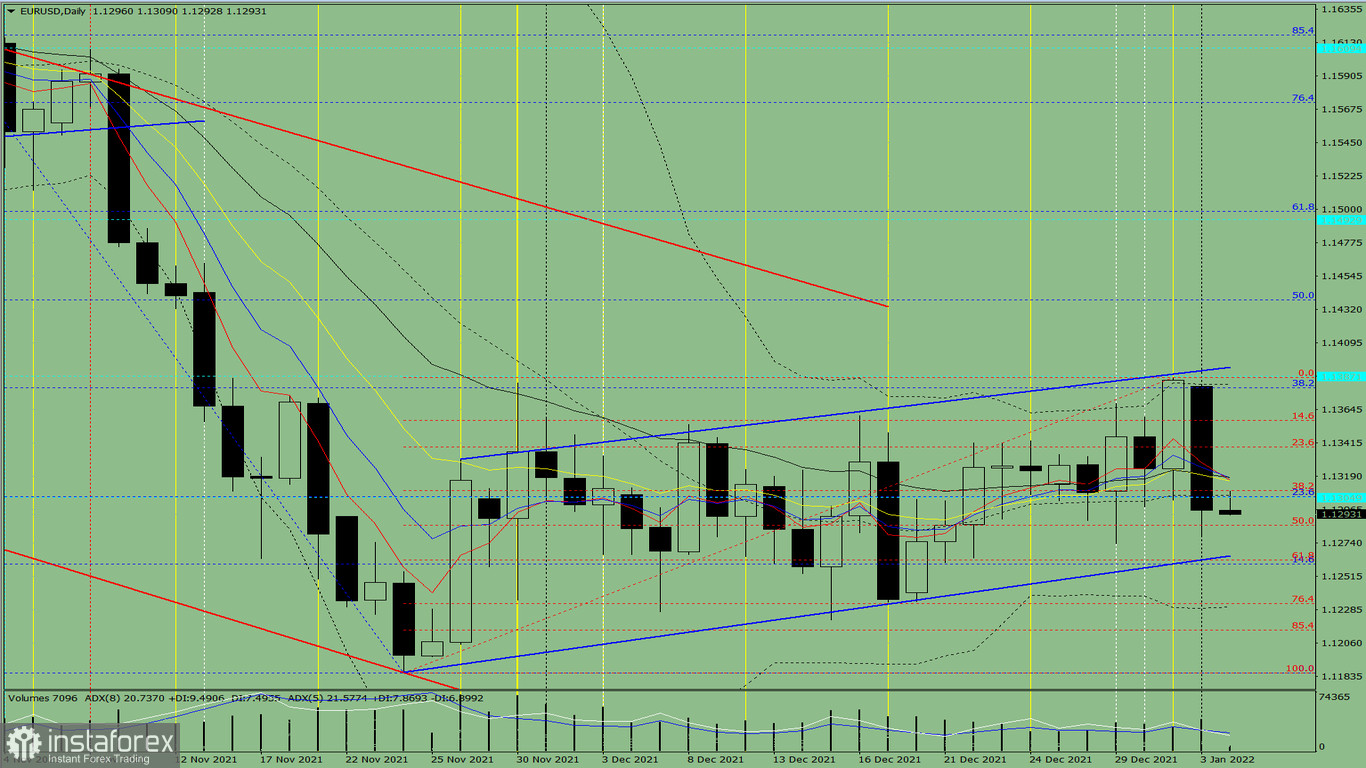
Fig. 1 (daily chart)
Comprehensive analysis:
- Indicator analysis - up;
- Fibonacci levels - up;
- Volumes - up;
- Candlestick analysis - up;
- Trend analysis - up;
- Bollinger lines - down;
- Weekly chart - up.
General conclusion:
The price may move down from the level of 1.1296 (closing of yesterday's daily candle) to reach the support level of 1.1265 (blue bold line). If this level is tested, the price may move upward to the target level of 1.1306, the 23.6% retracement level (blue dotted line), and then further up.
Alternative scenario: from the level of 1.1296 (closing of yesterday's daily candle), the price may move up to 1.1379, the 38.2% retracement level (blue dotted line).
InstaForex analytical reviews will make you fully aware of market trends! Being an InstaForex client, you are provided with a large number of free services for efficient trading.

