 Stay
Stay 
Trading Conditions
Products
Tools


Trend analysis (Fig. 1).
The euro-dollar pair may move down from the level of 1.0800 (close of Friday's daily candle) to the historical support level at 1.0769 (blue dotted line). Upon reaching this level, the price may continue to move down with the target at the historical support level 1.0657 (blue dotted line). From this level, the price may move up with the target at the lower fractal 1.0756 (red dotted line).
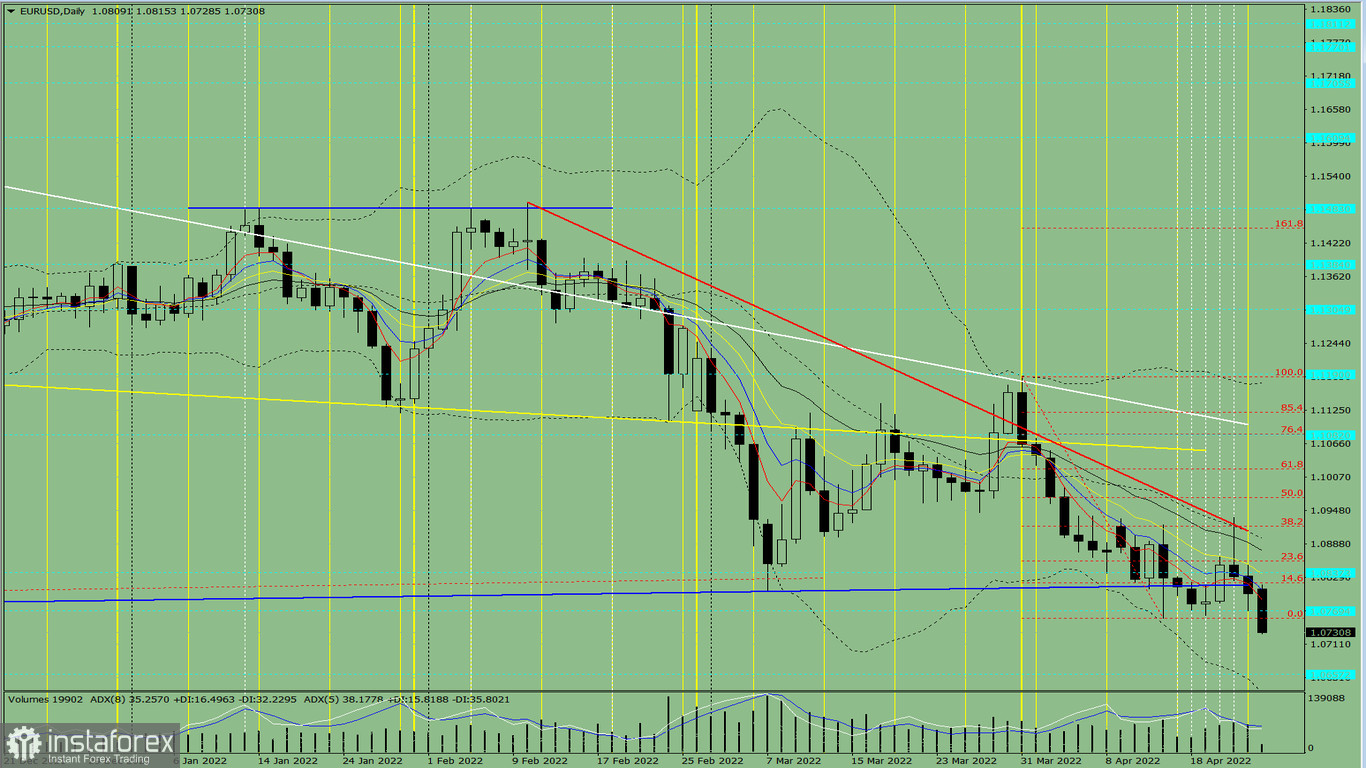
Fig. 1 (daily chart).
Comprehensive analysis:
General conclusion:
Today, the price may continue to move down from the level of 1.0800 (close of Friday's daily candle) to the historical support level at 1.0769 (blue dotted line). Upon reaching this level, the price may continue to move down with the target at the historical support level 1.0657 (blue dotted line). From this level, the price may move up with the target at the lower fractal 1.0756 (red dotted line).
Alternative scenario: from the level of 1.0800 (close of Friday's daily candle), the price may move down with the target at the historical support level 1.0657 (blue dotted line). After testing this level, the price may continue to move downward with the target of 1.0623, the lower limit of the Bollinger Band indicator (black dotted line).
InstaForex analytical reviews will make you fully aware of market trends! Being an InstaForex client, you are provided with a large number of free services for efficient trading.


