 Stay
Stay 
Trading Conditions
Products
Tools


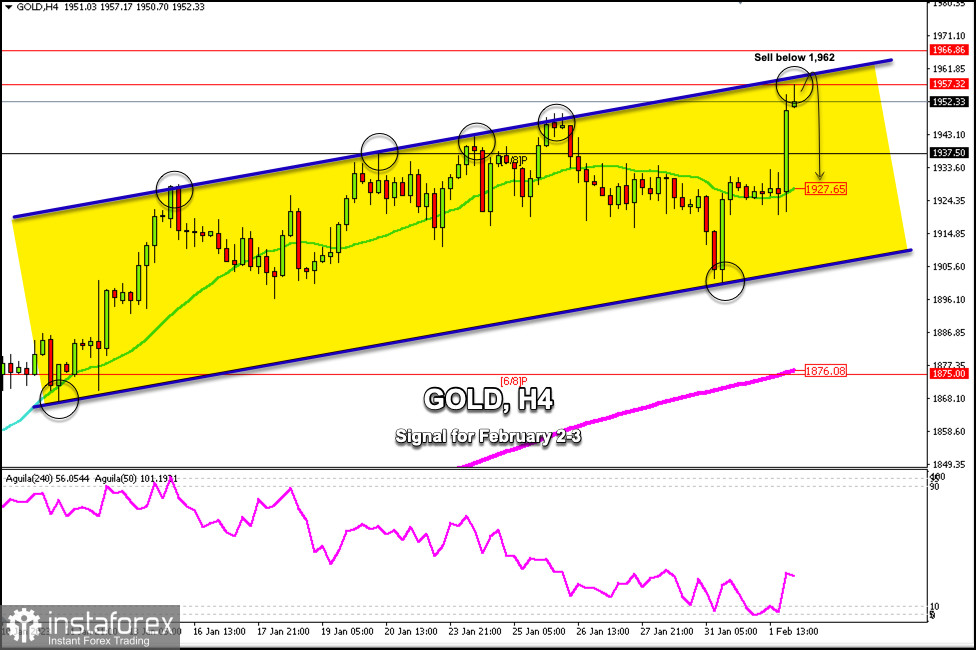
Early in the American session, gold is trading around 1,952.33. On the 4-hour chart, we can see that XAU/USD is trading within an uptrend channel formed since January 11. The key resistance zone is located from the area of 1,957 towards the daily resistance located at 1,962.
In case the yellow metal finds a rejection around this resistance zone or if it reaches the weekly resistance zone of around 1,966, there could be a strong technical correction and gold could reach the 1,949 zone. It could even reach the 21 SMA located in 1,927.
Yesterday, the XAU/USD pair received support after the US Federal Reserve increased its interest rate by 0.25%, which was widely expected by the markets and discounted in the price.
Gold is expected to have a strong technical correction in the next few hours and its price may reach 1,937 (7/8 Murray) levels and could even reach the 1,927 zone.
Given that XAU/USD is trading around a resistance zone that spans from 1,957 to 1,966, any rebound could be considered a sell signal.
The eagle indicator on the 1-hour chart is around 95 points which represents a strong technical correction, it is evident that gold could correct in the next few hours and reach support levels around 1,950, 1,945, and 1,937.
Our trading plan is to sell below 1,957 or in case the price reaches the area of 1,962, we could go short with targets towards 1,927 (21 SMA).
InstaForex analytical reviews will make you fully aware of market trends! Being an InstaForex client, you are provided with a large number of free services for efficient trading.


