 Stay
Stay 
Trading Conditions
Products
Tools


Data on the UK labor market came out worse than expected. The unemployment rate increased from 3.7% to 3.8%, while the forecast assumed a decline to 3.6%. Employment in the country rose by 177,000, while jobless claims fell less than expected.
In general terms, the indicators for the UK labor market are not the best.
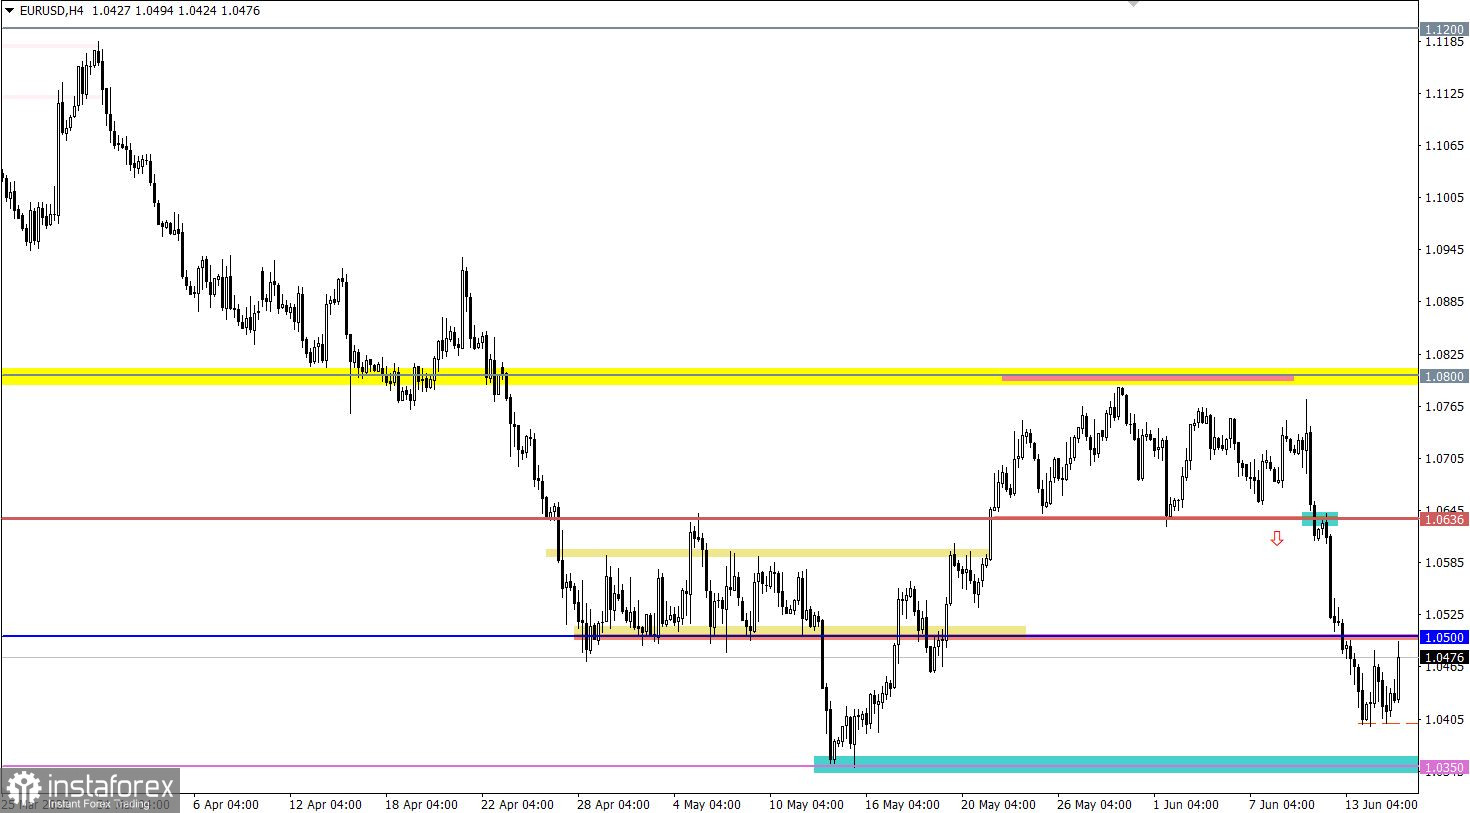
The EURUSD currency pair has slowed down its downward movement in the area of 1.0400. This move has led to variable turmoil, with the downside sentiment remaining among market participants.
On the trading chart of the daily period, there is a gradual recovery of the downward trend relative to the recent correction.
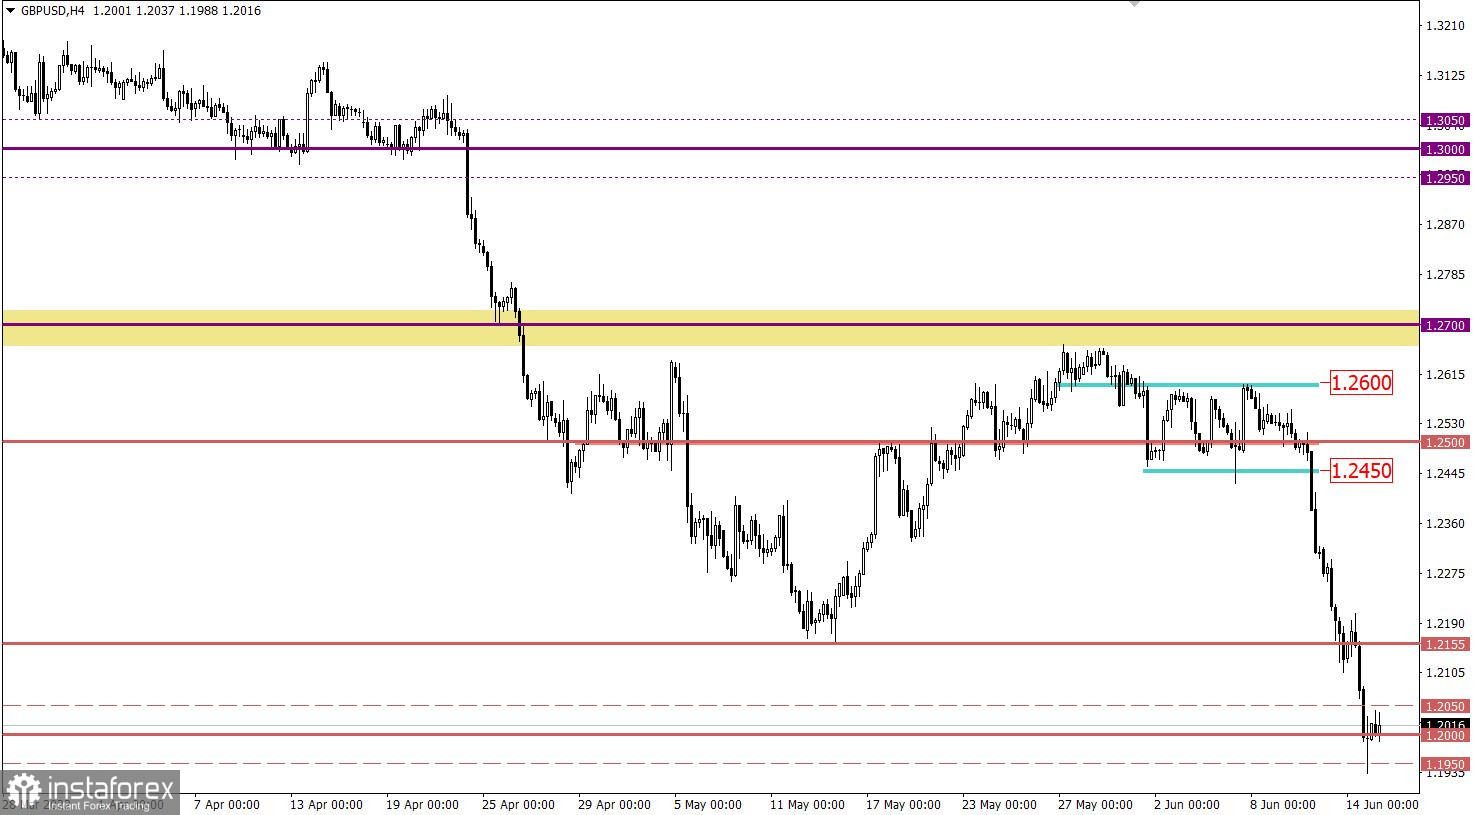
The GBPUSD currency pair has accelerated the decline after the prolongation of the medium-term downward trend. The increase in the volume of short positions led to the weakening of the pound sterling towards the psychologically important level of 1.2000. The scale of decline for three trading days amounted to about 550 points.

The results of the Fed meeting are at the center of everyone's attention, where, due to a sharp increase in the inflation rate, experts are revising forecasts for the interest rate hike. Based on the last meeting, the regulator planned to continue hanging the rate by 50 basis points. The market, in turn, is concerned about rising inflation and lays down a rate increase of 75 basis points at once, which has already affected the US dollar exchange rate.
Time targeting
Results of the Fed meeting - 18:00 UTC
Fed press conference - 18:30 UTC
Price stagnation within 1.0400/1.0500 keeps speculators on itself for a while. It can be assumed that the current stop plays the role of the accumulation of trading forces in the forthcoming acceleration in the market.
Based on the above range, the best trading tactic is the outgoing momentum method, which will indicate the subsequent price move.
We concretize the above into trading signals:
Buy positions on the currency pair are taken into account after holding the price above the value of 1.0500 in a four-hour period.
Sell positions should be considered after holding the price below 1.0400 in a four-hour period.
The area of psychological level 1.1950/1.2000/1.2050 puts pressure on sellers. This led to a reduction in the volume of short positions and, as a result, a local pullback. Taking into account the oversold status of the pound sterling, we can assume further formation of a correction if the price holds above 1.2050 in a four-hour period.
At the same time, the high interest of traders in speculative positions allows blocking the technical signal about the pound being oversold. In this case, holding the price below the value of 1.1950 in a four-hour period will lead to the subsequent inertial movement.
A candlestick chart view is graphical rectangles of white and black light, with sticks on top and bottom. When analyzing each candle in detail, you will see its characteristics of a relative period: the opening price, closing price, and maximum and minimum prices.
Horizontal levels are price coordinates, relative to which a stop or a price reversal may occur. These levels are called support and resistance in the market.
Circles and rectangles are highlighted examples where the price of the story unfolded. This color selection indicates horizontal lines that may put pressure on the quote in the future.
The up/down arrows are the reference points of the possible price direction in the future.
InstaForex analytical reviews will make you fully aware of market trends! Being an InstaForex client, you are provided with a large number of free services for efficient trading.


