 Stay
Stay 
Trading Conditions
Products
Tools


The ECB raised the interest rate for the first time in 11 years, and immediately by 50 basis points, from zero to 0.5%. According to European Central Bank President Christine Lagarde, the decision of the Board of Governors was based on an updated assessment of inflation risks.
The next steps on the interest rate will depend on the statistical data.
Key messages:
• the refinancing rate was raised to 0.5%
• the rate on the deposit and the marginal lending facility was raised to 0.00% and 0.75%, respectively
• the ECB introduced a new Transmission Protection Instrument (TPI) to limit fragmentation in the European bond markets
• Lagarde:
- the operation of the TPI mechanism will not affect the current policy of the ECB
- the volume of the TPI program can be quite large
- no recession in ECB base case
- still a high risk of further growth of inflation; further tightening of monetary policy is appropriate
In all this new TPI mechanism, the old QE scheme is visible, thereby confusing the market.
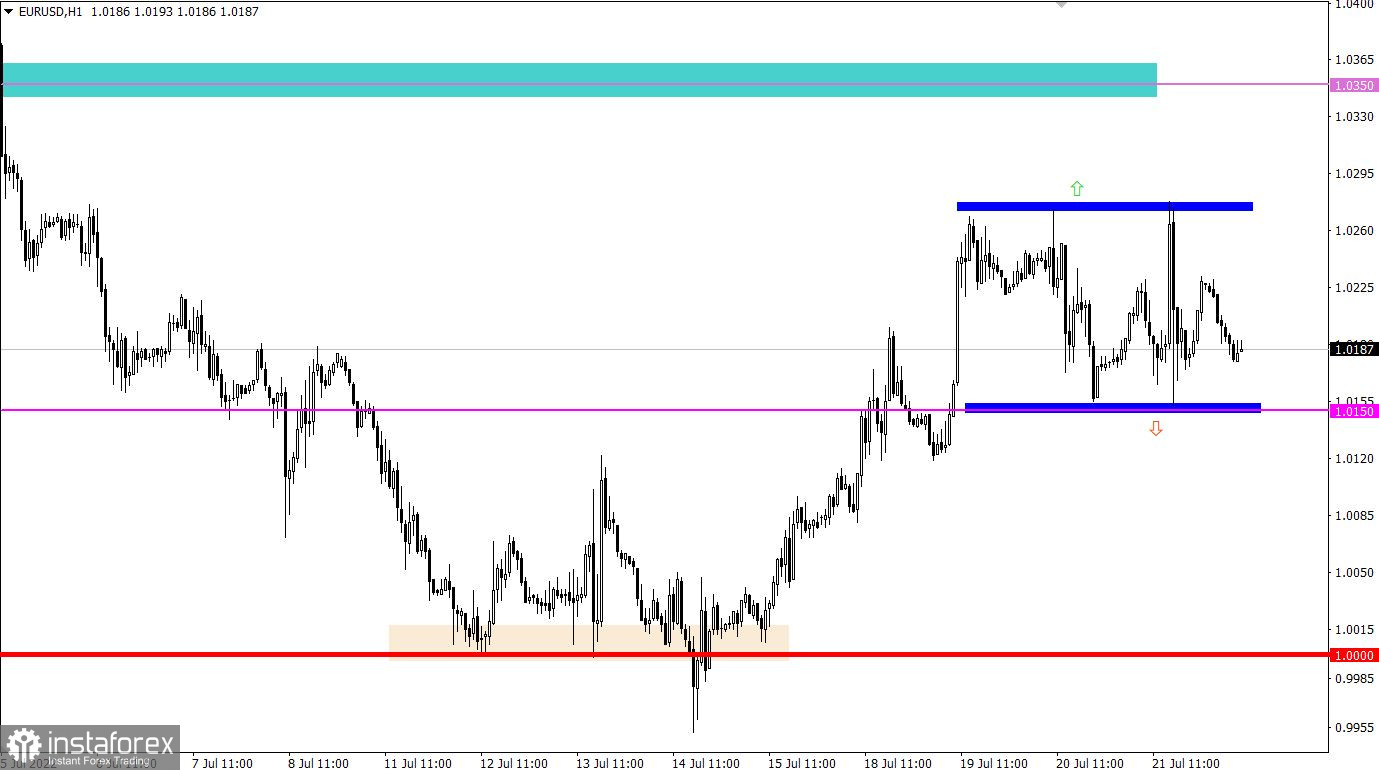
The EURUSD currency pair showed only local speculative interest during the publication of the results of the ECB meeting and the press conference. The scale of fluctuations was about 100 points. As a result, the current amplitude formed a short-term flat within 1.0150/1.0270.
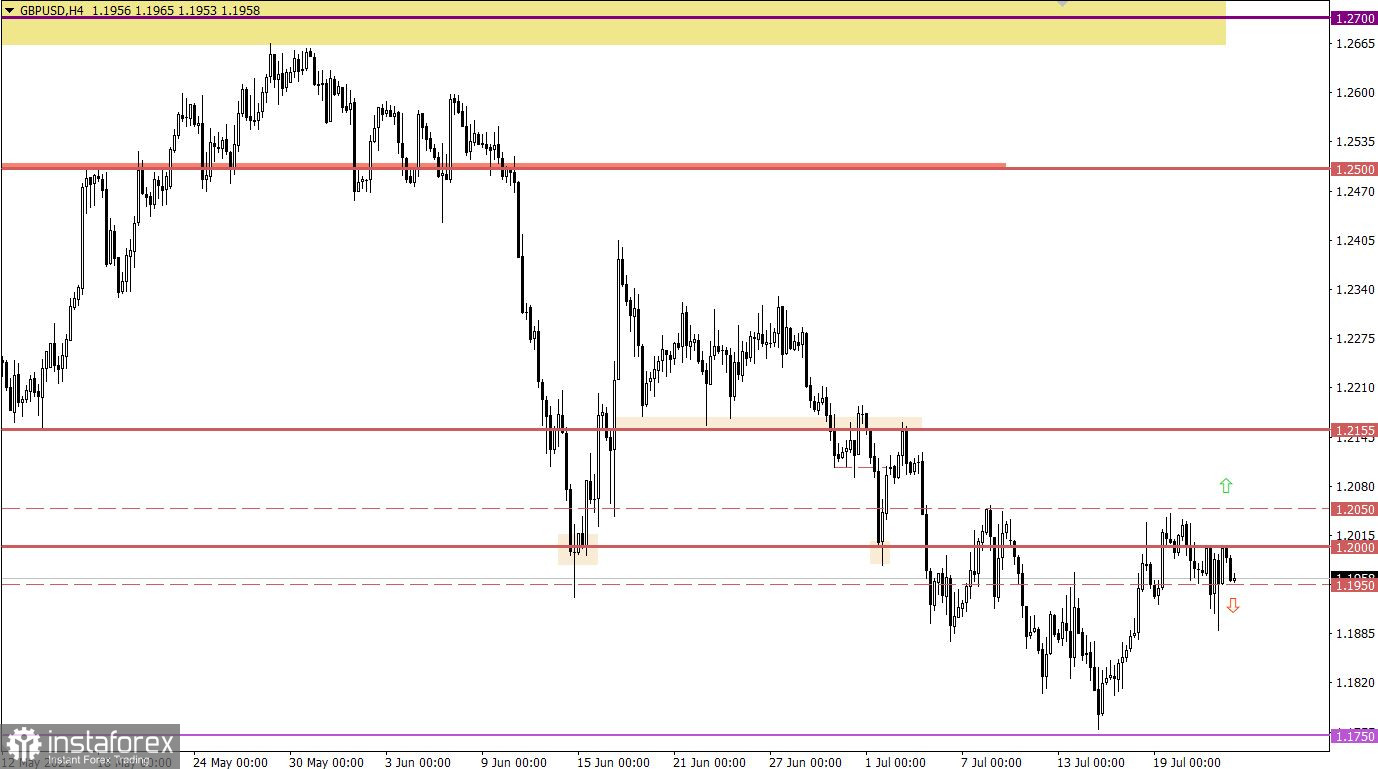
The GBPUSD currency pair, following the euro, repeats all the price fluctuations available on the market. Initially, there were speculations, after which the quote safely returned to the psychological level of 1.2000.

The trading week ends with the widespread publication of preliminary data on business activity indices, which will not affect the mood of market participants in any way. For the reason that the same result is expected everywhere—all indices should decrease slightly. And since the picture is the same, there is no reason for fuss.
Time targeting
EU PMI - 08:00 UTC
UK PMI - 08:30 UTC
US PMI - 13:45 UTC
In this situation, the current range grabs all the attention of traders. For this reason, breaking through one or another flat border is considered the most appropriate trading tactic.
We concretize the above into trading signals:
Buy positions on the currency pair can be considered after holding the price above the value of 1.0280 in a four-hour period.
Sell positions can be considered after holding the price below the value of 1.0115 in a four-hour period.
As of this writing, the quote is moving in the lower area of the control level 1.1950/1.2000. It is a temporary manifestation of the price, as its return below 1.1950 may increase the volume of short positions toward 1.1900.
The resumption of the quote's move within the boundaries of the previously passed flat 1.1950/1.2050 is not excluded if it goes above 1.2000.
A candlestick chart view is graphical rectangles of white and black light, with sticks on top and bottom. When analyzing each candle in detail, you will see its characteristics of a relative period: the opening price, closing price, and maximum and minimum prices.
Horizontal levels are price coordinates, relative to which a stop or a price reversal may occur. These levels are called support and resistance in the market.
Circles and rectangles are highlighted examples where the price of the story unfolded. This color selection indicates horizontal lines that may put pressure on the quote in the future.
The up/down arrows are the reference points of the possible price direction in the future.
InstaForex analytical reviews will make you fully aware of market trends! Being an InstaForex client, you are provided with a large number of free services for efficient trading.


