 Stay
Stay 
Trading Conditions
Products
Tools


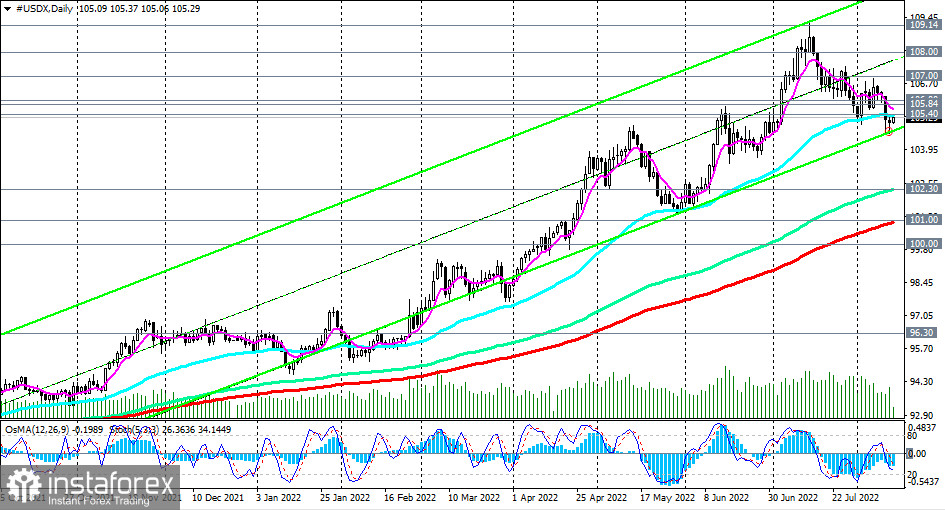
As of this writing, the dollar index (CFD #USDX) is trading near the 105.30 mark, bouncing off the intraweek low of 104.52 and trying to break through the zone above the important resistance level of 105.40 (50 EMA on the daily chart).
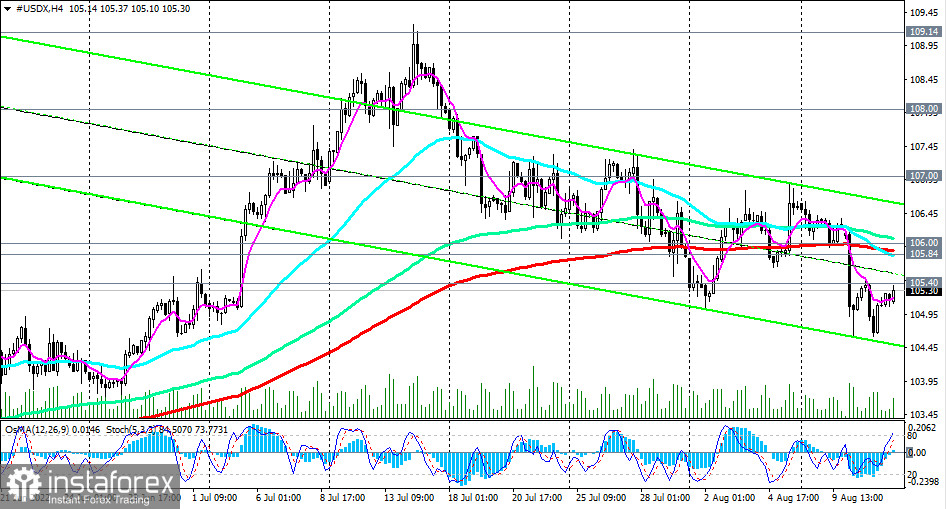
The breakdown of the local resistance level of 106.00 will be the first signal of the resumption of the positive dynamics of the dollar and its DXY index. The break of the level of 107.00 will be a confirming signal for increasing long positions on the dollar.
In an alternative scenario, and after the breakdown of the local support level 104.50, the negative dynamics of DXY will increase, and the price may drop to the key support levels 102.30 (144 EMA on the daily chart), 101.00 (200 EMA on the daily chart).
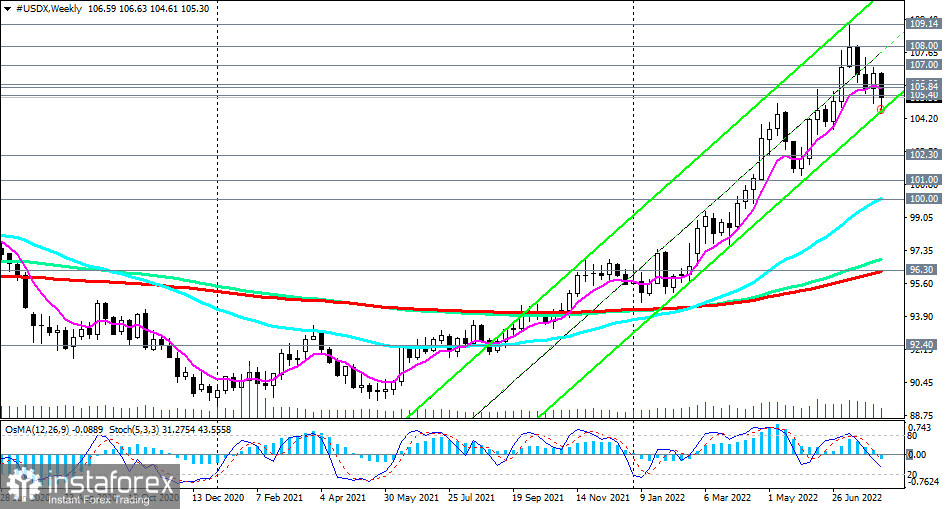
A break of 100.00 (and the 50 EMA support level on the weekly chart) will be the beginning of a break in the DXY bullish trend.
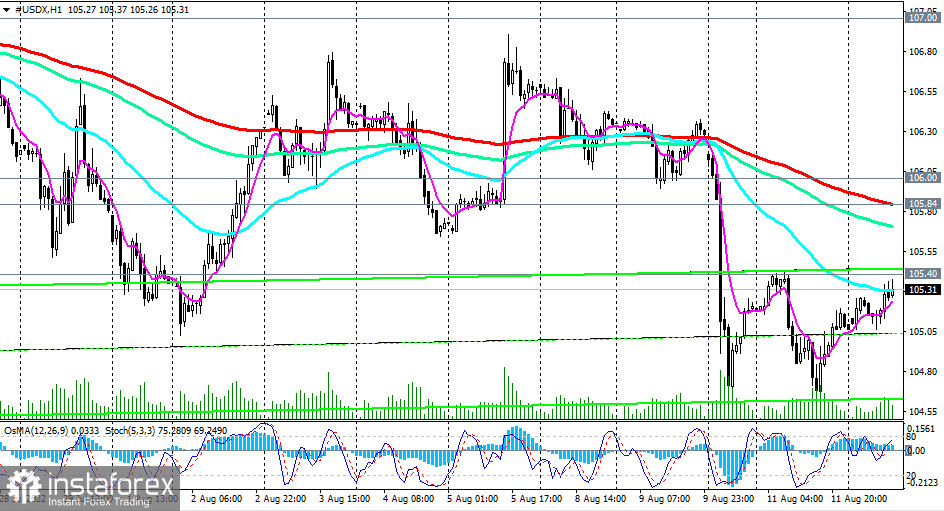
Given the continuing positive dynamics of the dollar and the bullish trend of DXY, most likely, the breakdown of the resistance levels of 105.84 (200 EMA on the 1-hour, 4-hour charts), 106.00 will signal the resumption of long positions.
Support levels: 104.50, 104.00, 103.00, 102.30, 101.00, 100.00
Resistance levels: 105.40, 105.84, 106.00, 107.00, 107.50, 108.00, 109.00
Trading Tips
Sell Stop 104.45. Stop-Loss 105.60. Take-Profit 104.00, 103.00, 102.30, 101.00, 100.00
Buy Stop 105.60. Stop-Loss 104.45. Take-Profit 105.84, 106.00, 107.00, 107.50, 108.00, 109.00, 110.00, 111.00
InstaForex analytical reviews will make you fully aware of market trends! Being an InstaForex client, you are provided with a large number of free services for efficient trading.

