 Stay
Stay 
Trading Conditions
Products
Tools


Last week ended with a triumphant speech by Federal Reserve Chairman Jerome Powell at the annual economic symposium in Jackson Hole.
What was said?
Jerome Powell did not say anything new, but only confirmed everything that was said at the July meeting.
Main theses:
- The central bank will keep the interest rate at high levels, despite a possible recession.
- Lowering the inflation rate is good. But not enough to change its monetary policy (MP) now, or give hints about a rate cut in 2023.
- History warns against premature easing of policy.
- The longer the current period of high inflation continues, the more likely it is that higher inflation expectations will take hold.
- We must continue until the job is done.
- At the upcoming Fed meeting
Fed meeting (21.09.22), the decision will depend on inflation data for August.
- Slowing down the pace of rate hikes literally - at some point.
Also, Powell did not deny hints that in September there will be a significant increase in interest rates, it all depends on the statistics and the situation. The rhetoric has not changed here.
Conclusion
Based on the material, it becomes clear that the bearish mood in the US stock market, as well as the bullish mood for the dollar.
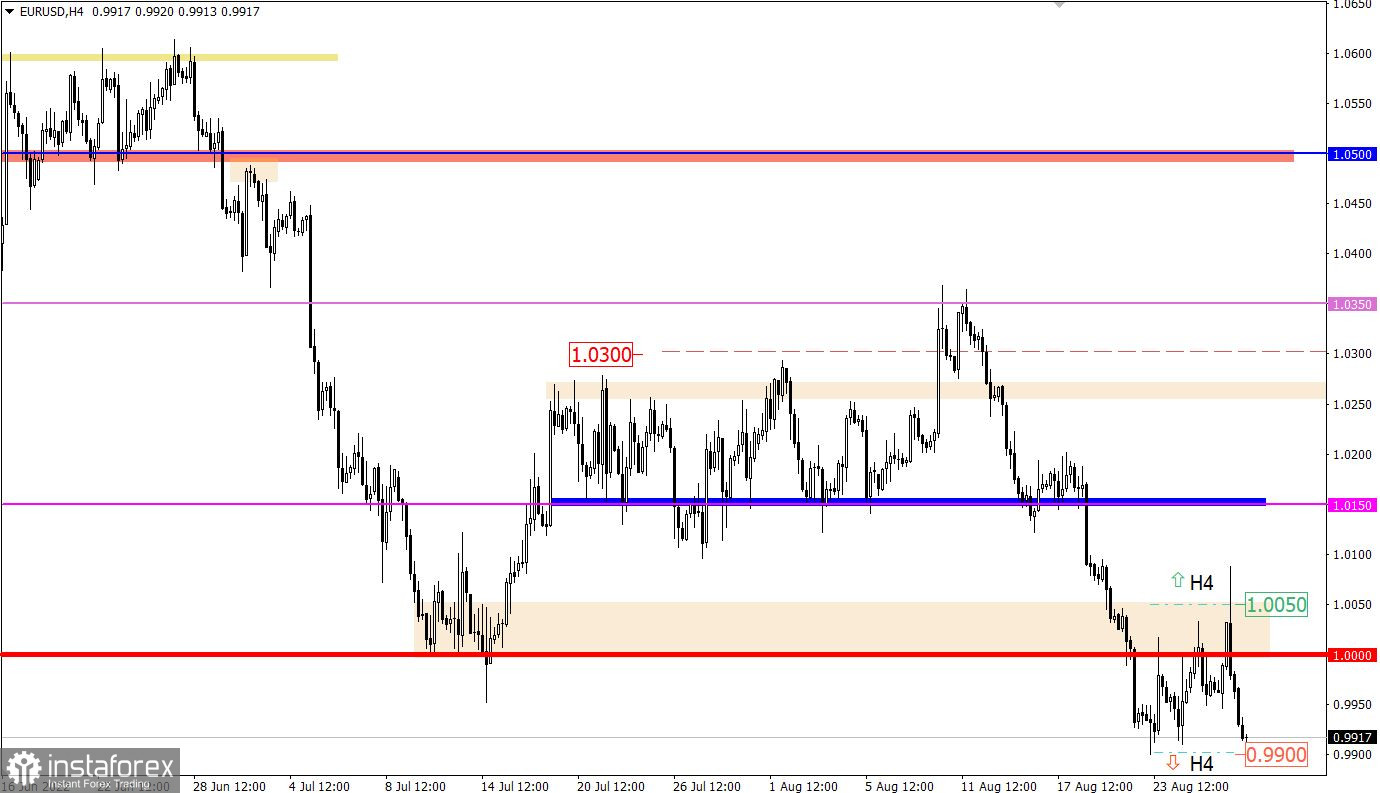
The EURUSD currency pair during Friday's speculations locally jumped above the control mark of 1.0050, but the market participants failed to hold on to the given level. Almost immediately, a reversal occurred, where speculators began to actively increase the volume of dollar positions throughout the Forex market.
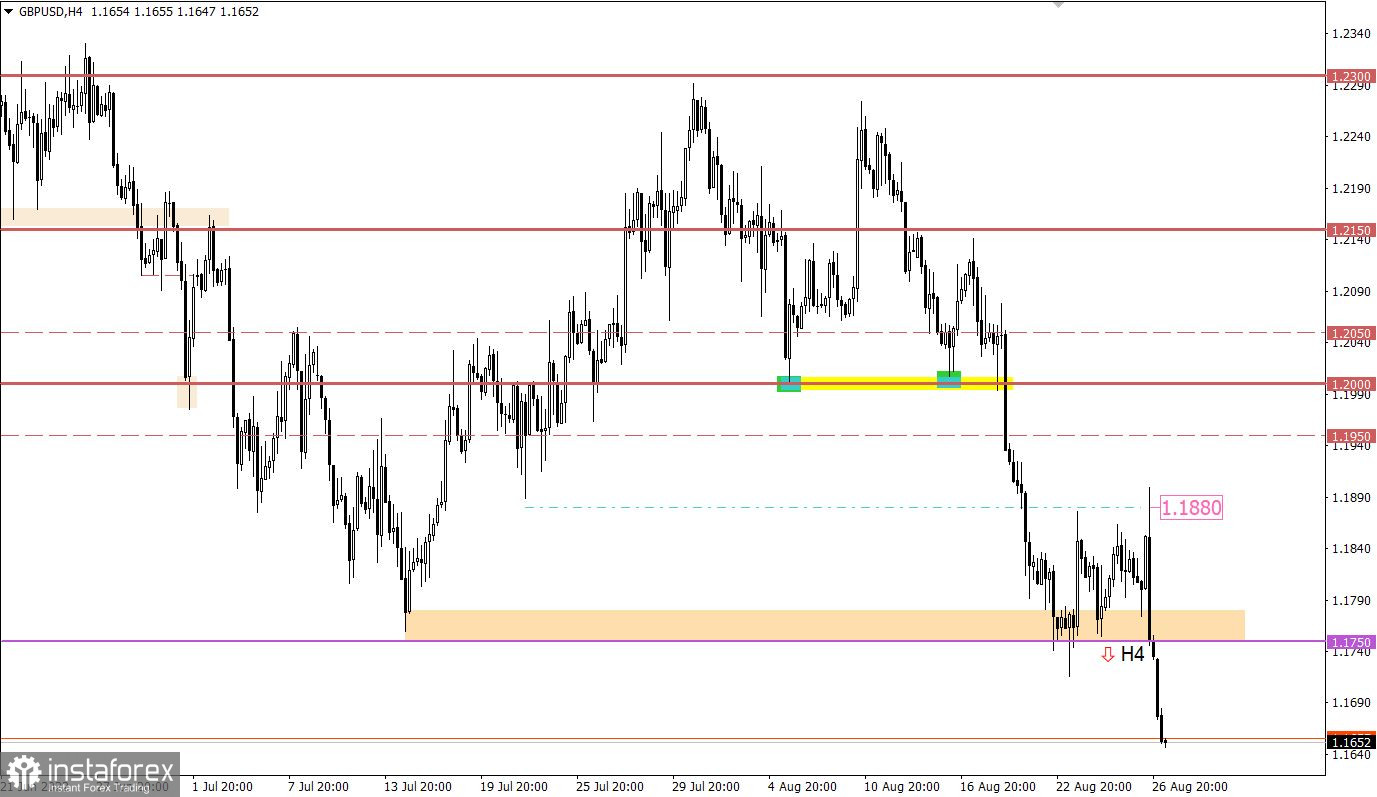
The GBPUSD currency pair fell by more than 200 points during the inertial downward movement. As a result, the medium-term trend was prolonged, where the quote fell below 1.1650. Such an intense speculative move is caused by the general market mood.

Monday is traditionally accompanied by a blank macroeconomic calendar. Important statistics in Europe, the UK and the United States are not expected. It is also worth considering that today is a public holiday in the UK.
In this regard, investors and traders will be guided by the information flow of last Friday.
Further weakening of the euro, which will lead to a continuation of the trend, is expected after keeping the price below 0.9900 in a four-hour period.
Until then, the risk of a price rebound remains, following the example of August 23 and 24.
In this situation, there is a characteristic signal that the pound is oversold in short-term time periods. This may lead to a technical rollback towards the previously passed level of 1.1750.
At the same time, we cannot rule out a scenario of a further decline in the quote, where technical signals are ignored by speculators. In this case, the inertial course will continue to form in the direction of the local low of 2020.
The candlestick chart type is white and black graphic rectangles with lines at the top and bottom. With a detailed analysis of each individual candle, you can see its characteristics relative to a particular time period: opening price, closing price, high and lowest price;
Horizontal levels are price coordinates, relative to which a stop or a price reversal can occur. In the market, these levels are called support and resistance;
Circles and rectangles are highlighted examples where the price of the story unfolded. This color selection indicates horizontal lines that may put pressure on the quote in the future;
The up/down arrows are landmarks of the possible price direction in the future.
InstaForex analytical reviews will make you fully aware of market trends! Being an InstaForex client, you are provided with a large number of free services for efficient trading.


