 Stay
Stay 
Trading Conditions
Products
Tools


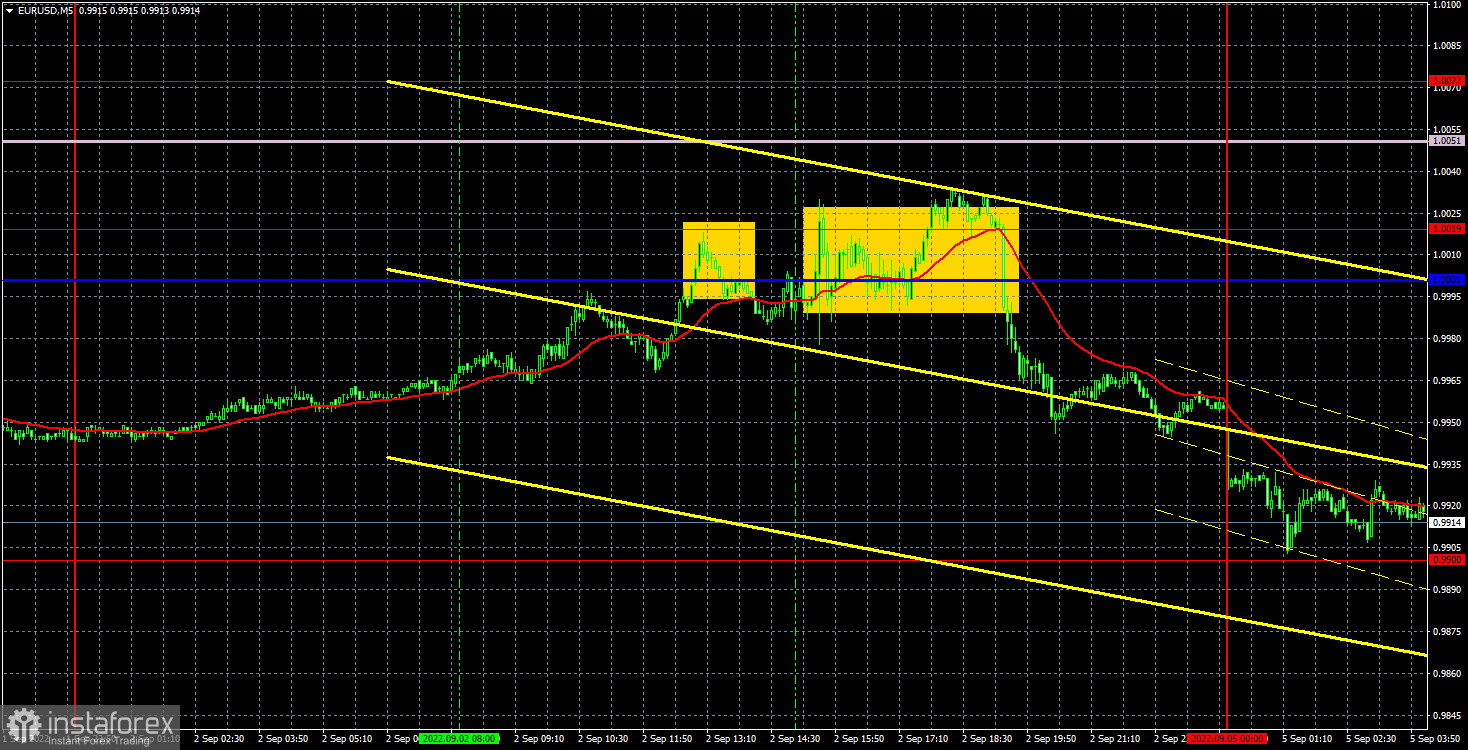
The EUR/USD pair showed multidirectional movements last Friday. If in the first half of the day it grew quite confidently, then in the second half it fell quite significantly. Recall that the pair has been inside the 0.9900-1.0072 horizontal channel for more than two weeks, which is clearly seen in the chart below. Therefore, any movement within the channel can be considered logical. At the moment, the quotes have fallen to the level of 0.9900, which is also logical and expected, since this fall was preceded by a rebound from the level of 1.0072. A large number of important macroeconomic statistics were also published on Friday. The main news of the day was the NonFarm Payrolls report in the US. The number of new jobs created amounted to 315,000 in August, which, in our opinion, is a very good figure and higher than experts' forecasts. Thus, the growth of the US currency does not surprise us. The unemployment rate rose to 3.7%, but traders did not react to it in any way, because unemployment is a less significant report than Nonfarm. As a result, the pair will try to overcome the level of 0.9900 and, if it succeeds, the global downward trend will resume.
In regards to Friday's trading signals, everything was quite complicated. All signals formed near the 1.0001-1.0019 area. And there were only two of them, and both were extremely inaccurate. However, the price bounced twice from the indicated area, and traders were able to open a short position twice. They could, but they shouldn't have. The first signal was formed just half an hour before the release of the Nonfarm report, so it was too risky to open a deal. The second signal was formed a few hours before the market closed, so it also needed to be filtered out.
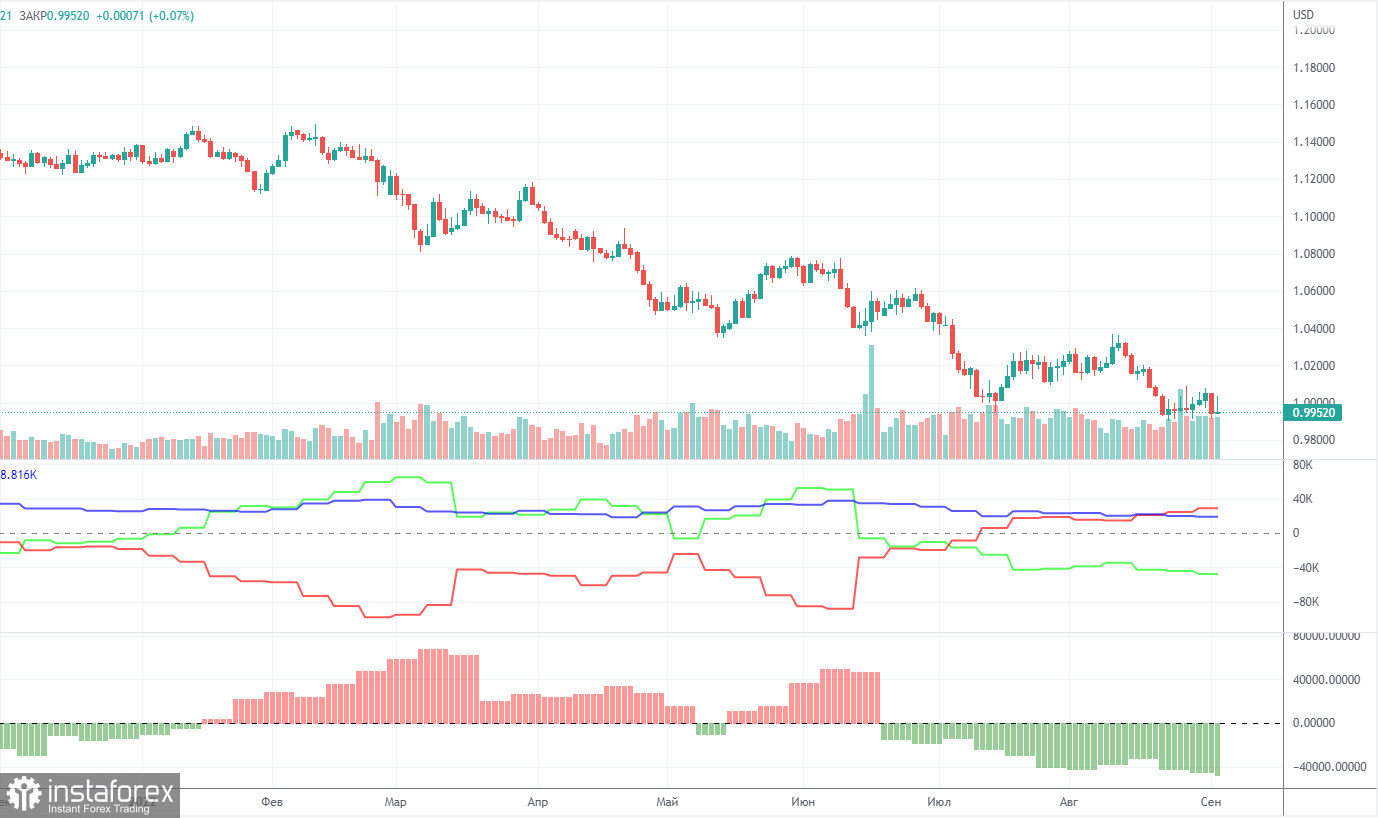
The Commitment of Traders (COT) reports on the euro in the last few months clearly reflect what is happening in the euro/dollar pair. For most of 2022, they showed an openly bullish mood of commercial players, but at the same time, the euro fell steadily at the same time. At this time, the situation is different, but it is NOT in favor of the euro. If earlier the mood was bullish, and the euro was falling, now the mood is bearish and... the euro is also falling. Therefore, for the time being, we do not see any grounds for the euro's growth, because the vast majority of factors remain against it. During the reporting week, the number of long positions for the non-commercial group decreased by 8,500, and the number of shorts decreased by 5,000. Accordingly, the net position decreased by about 3,500 contracts. This is not much, but this is again an increase in the bearish mood among the major players. After several weeks of weak growth, the decline in this indicator resumed. From our point of view, this fact very eloquently indicates that at this time even commercial traders still do not believe in the euro. The number of longs is lower than the number of shorts for non-commercial traders by 47,000. Therefore, we can state that not only does the demand for the US dollar remain high, but that the demand for the euro is also quite low. The fact that major players are in no hurry to buy the euro may lead to a new, even greater fall. The euro has not been able to show even a tangible correction over the past six months or a year, not to mention something more.
Forecast and trading signals for GBP/USD on September 5. Detailed analysis of the movement of the pair and trading transactions.
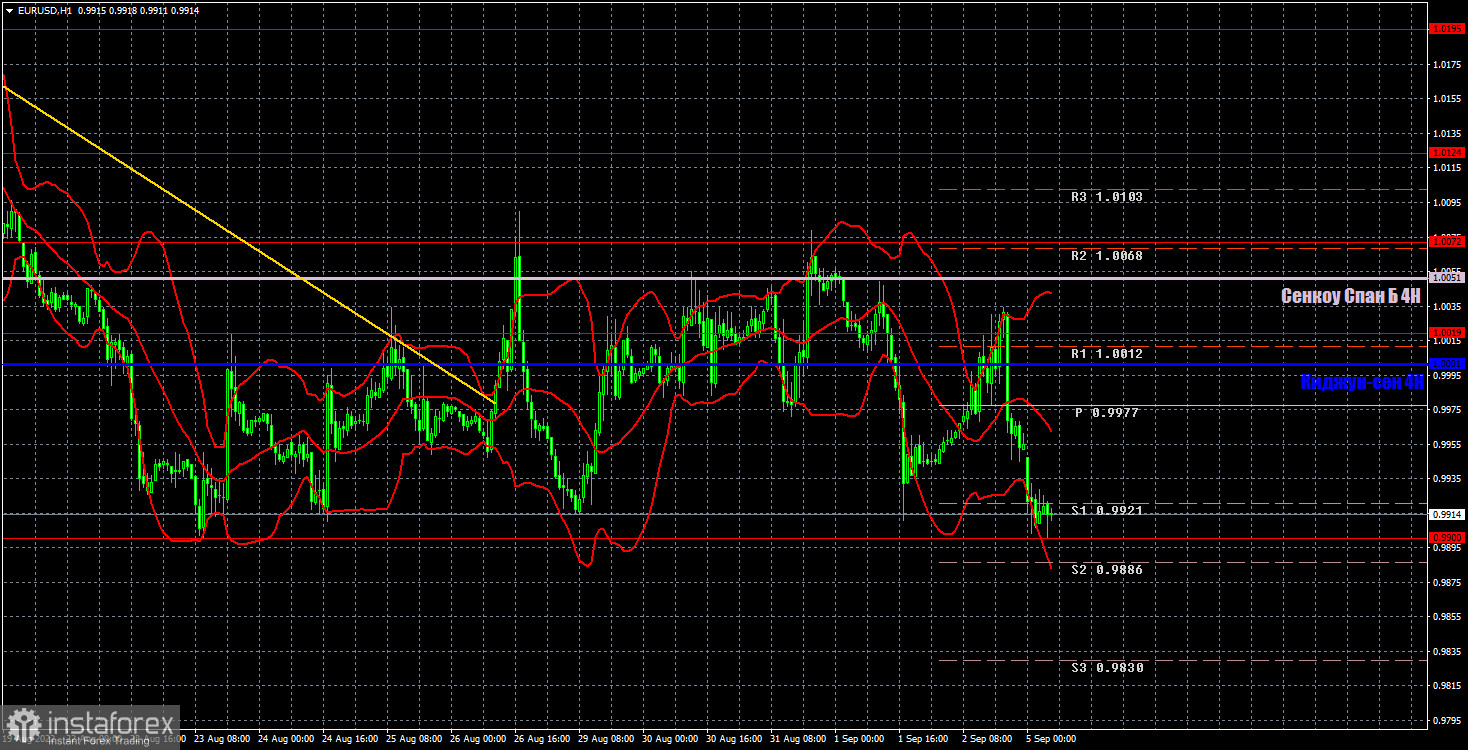
The pair continues to be inside the 0.9900-1.0072 horizontal channel on the hourly timeframe. If the bears manage to settle below it (which may happen today), then it will be possible to count on the resumption of the global downward trend. Otherwise, the swing will remain. We highlight the following levels for trading on Monday - 0.9900, 1.0019, 1.0072, 1.0124, 1.0195, 1.0269, as well as Senkou Span B (1.0051) and Kijun-sen (1.0001). There is not a single level below 0.9900, so there is simply nothing to trade there. Ichimoku indicator lines can move during the day, which should be taken into account when determining trading signals. There are also secondary support and resistance levels, but no signals are formed near them. Signals can be "rebounds" and "breakthrough" extreme levels and lines. Do not forget about placing a Stop Loss order at breakeven if the price has gone in the right direction for 15 points. This will protect you against possible losses if the signal turns out to be false. The European Union will publish the index of business activity in the service sector for August (final value) and retail sales, and there's nothing in America. Not the most important reports, plus traders are now trading quite actively even without them.
Support and Resistance Levels are the levels that serve as targets when buying or selling the pair. You can place Take Profit near these levels.
Kijun-sen and Senkou Span B lines are lines of the Ichimoku indicator transferred to the hourly timeframe from the 4-hour one.
Support and resistance areas are areas from which the price has repeatedly rebounded off.
Yellow lines are trend lines, trend channels and any other technical patterns.
Indicator 1 on the COT charts is the size of the net position of each category of traders.
Indicator 2 on the COT charts is the size of the net position for the non-commercial group.
InstaForex analytical reviews will make you fully aware of market trends! Being an InstaForex client, you are provided with a large number of free services for efficient trading.


