 Stay
Stay 
Trading Conditions
Products
Tools


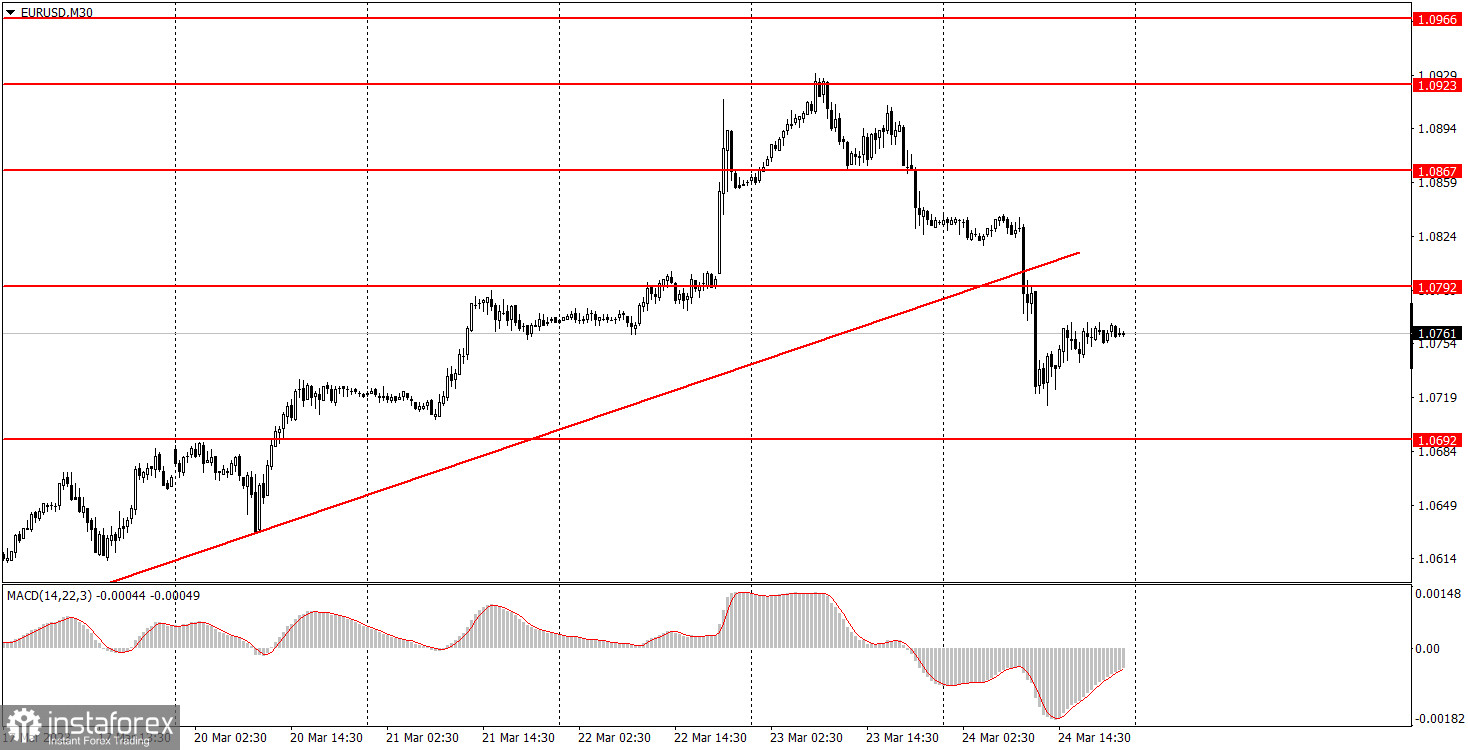
On Friday, EUR/USD continued its bearish corrective movement and overcame the ascending trend line. Lately, I have been saying that I expect the euro to fall instead of rise. Simply because I don't see any good reason for it to rise further when it has already grown 1,500 points in the second half of 2022. The European Central Bank and the Federal Reserve are slowly preparing for the end of the monetary tightening cycle and at each subsequent meeting they make quite expected decisions. The ECB's policy is no more hawkish than the Fed's. On Friday, the quotes plummeted during the European session. At that time, only the PMIs of the manufacturing and services sectors of Germany and the EU were published. Considering the fact that the euro was falling at that time, we can conclude that traders were watching the manufacturing sectors (PMIs were down), but ignored the services sectors. Thus, the reaction was very one-sided.
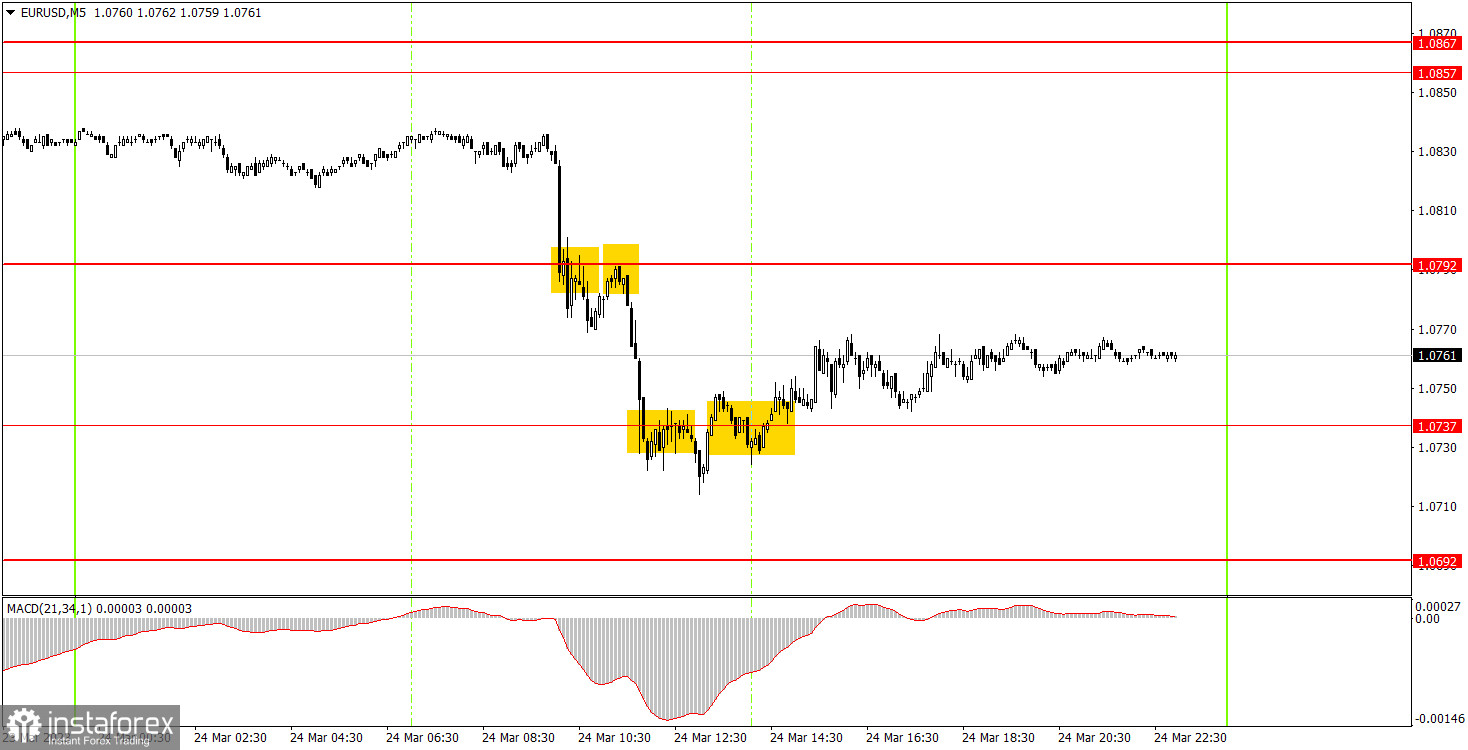
On the 5-minute chart, several trading signals were formed. It was hardly possible to catch the time when the quotes started to fall. Nevertheless, when the pair crossed 1.0792, beginners had an opportunity to open short positions. The pair reached 1.0737, but was not able to go further down. Therefore, at the next buy signal, it was necessary to close shorts and open longs. The profit on the short position was about 30 points. The long position did not bring much profit, but it was possible to gain 10-20 points. This position should have been manually closed closer to the evening. Thus, 40-50 pips were gained, which makes the day quite good.
On the 30-minute chart, the pair finished forming an uptrend and now it might fall, as I've long expected. I think that over the last weeks, the euro has exhausted its growth potential, and it rose even more than it should have. On the 5-minute chart, it is recommended to trade at the levels 1.0465-1.0483, 1.0535, 1.0587-1.0607, 1.0692, 1.0737, 1.0792, 1.0857-1.0867, 1.0920-1.0933, 1.0966, 1.0989. As soon as the price passes 15 pips in the right direction, you should set a Stop Loss to breakeven. ECB representatives Schnabel and Elderson will speak on Monday. It is not certain that monetary policy will be discussed at all during these events, but there will be no other events on the first day of the week.
1) The strength of the signal is determined by the time it took the signal to form (a rebound or a breakout of the level). The quicker it is formed, the stronger the signal is.
2) If two or more positions were opened near a certain level based on a false signal (which did not trigger a Take Profit or test the nearest target level), then all subsequent signals at this level should be ignored.
3) When trading flat, a pair can form multiple false signals or not form them at all. In any case, it is better to stop trading at the first sign of a flat movement.
4) Trades should be opened in the period between the start of the European session and the middle of the US trading hours when all positions must be closed manually.
5) You can trade using signals from the MACD indicator on the 30-minute time frame only amid strong volatility and a clear trend that should be confirmed by a trendline or a trend channel.
6) If two levels are located too close to each other (from 5 to 15 pips), they should be considered support and resistance levels.
Support and Resistance levels are the levels that serve as targets when buying or selling the pair. You can place Take Profit near these levels.
Red lines are channels or trend lines that display the current trend and show in which direction it is better to trade now.
The MACD indicator (14, 22, and 3) consists of a histogram and a signal line. When they cross, this is a signal to enter the market. It is recommended to use this indicator in combination with trend patterns (channels and trendlines).
Important announcements and economic reports that can be found on the economic calendar can seriously influence the trajectory of a currency pair. Therefore, at the time of their release, we recommend trading as carefully as possible or exiting the market in order to avoid sharp price fluctuations.
Beginners on Forex should remember that not every single trade has to be profitable. The development of a clear strategy and money management is the key to success in trading over a long period of time.
InstaForex analytical reviews will make you fully aware of market trends! Being an InstaForex client, you are provided with a large number of free services for efficient trading.


