 Stay
Stay 
Trading Conditions
Products
Tools


The GBP/USD currency pair showed growth again on Wednesday, but all the movements of recent weeks have been extremely chaotic. The pair are appreciating, but the magnitude of the movements does not correspond to each other. The fundamental and macroeconomic background needs to be more present. The pound increased during the day yesterday, but there were no grounds for such a movement. It is because there were no interesting events or publications in the US or the UK throughout the day. Therefore, the current situation is highly unusual.
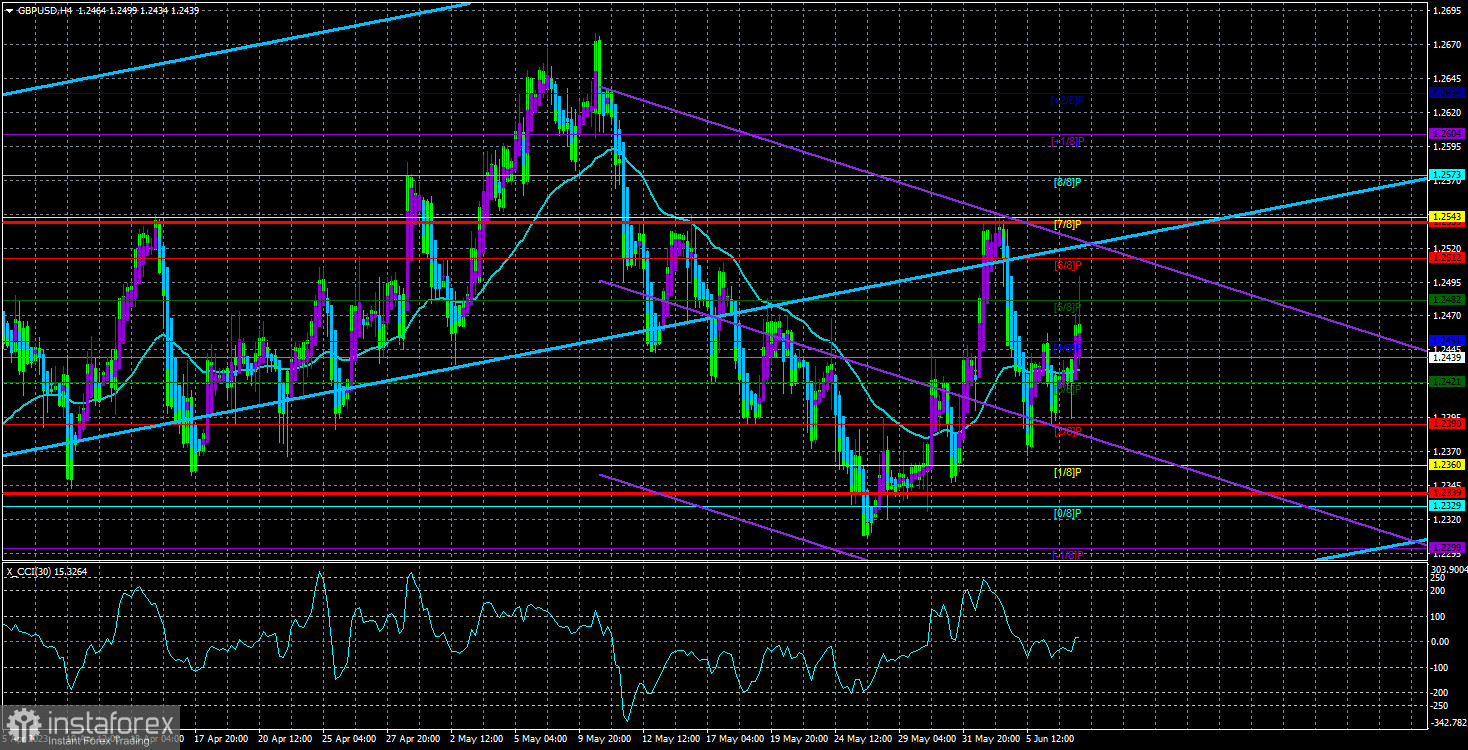
Since the average volatility of the pound over the past 30 days is 90 points, trading the pair is still possible, but only on the lower time frames where these movements can be caught and worked on in time. In the 4-hour time frame, the price changes direction too frequently, as evidenced by the Heiken Ashi indicator. The pair continues to hover around the critical line on the daily time frame. It has bounced off it, but the decline has not started yet. And it is unlikely that the market situation will change by the end of the week, as no important events are planned in the US or the UK. Therefore, yesterday the pair was rising, and today it may fall without any valid reasons.
The "head and shoulders" pattern looked very promising, but even it could not withstand the current market chaos. The Murray level of "4/8"-1.2451 was again broken, and the price reached a new local maximum. Therefore, the second "shoulder" of the pattern is already too high, much higher than the first one. Consequently, we conclude that the pattern is ineffective and irrelevant.
The dollar has every reason to rise, but it is not rising. Apart from the Bank of England and the Federal Reserve's interest rates, there is nothing to talk about now. Yesterday, information was received that Wall Street has revised its forecasts for the year-end Fed rate. Previously, the US stock market showed optimistic growth in anticipation of a 4% monetary policy easing by December, but now economists believe we should expect 5%. Honestly, it is difficult for us to say why the key experts in the investment field thought that the Fed would start reducing the rate already in the second half of the year (as it still needs to be lowered from the current 5.25% to 4%) if as of June, the regulator continues to raise it. But the "hawkish" position of the Fed is stronger than the markets expected.
It is also worth noting that most experts considered the May tightening the last in the cycle a few weeks ago. And we were among them. However, the harsh reality and the strong US labor market show that the rate may increase one or two more times, which the market could not anticipate and adjust to in advance. About half of the Federal Reserve's monetary policy committee favors raising rates on June 13-14 or in July (transitioning to a step of one increase every two meetings). Therefore, the American currency has additional grounds to strengthen against the pound. Moreover, monetary policy information has not been received from the Bank of England lately. However, the market either waits or wants to avoid buying the dollar. Either way, the pound has only fallen by 350 points (from the maximum to the minimum within the recent downward movement), which is insufficient to conclude that the downward correction is sufficient.
We still expect a more significant decline, but we continue to warn traders about the high resistance of the pound against the dollar. The pound, which plummeted to its historic lows last year, is showing a miracle growth this year. In the short term, the movement most closely resembles "swings." There is no clear trend, and the moving average line on the 4-hour time frame is crossed twice daily. The Heiken Ashi indicator changes direction every two to three candles.
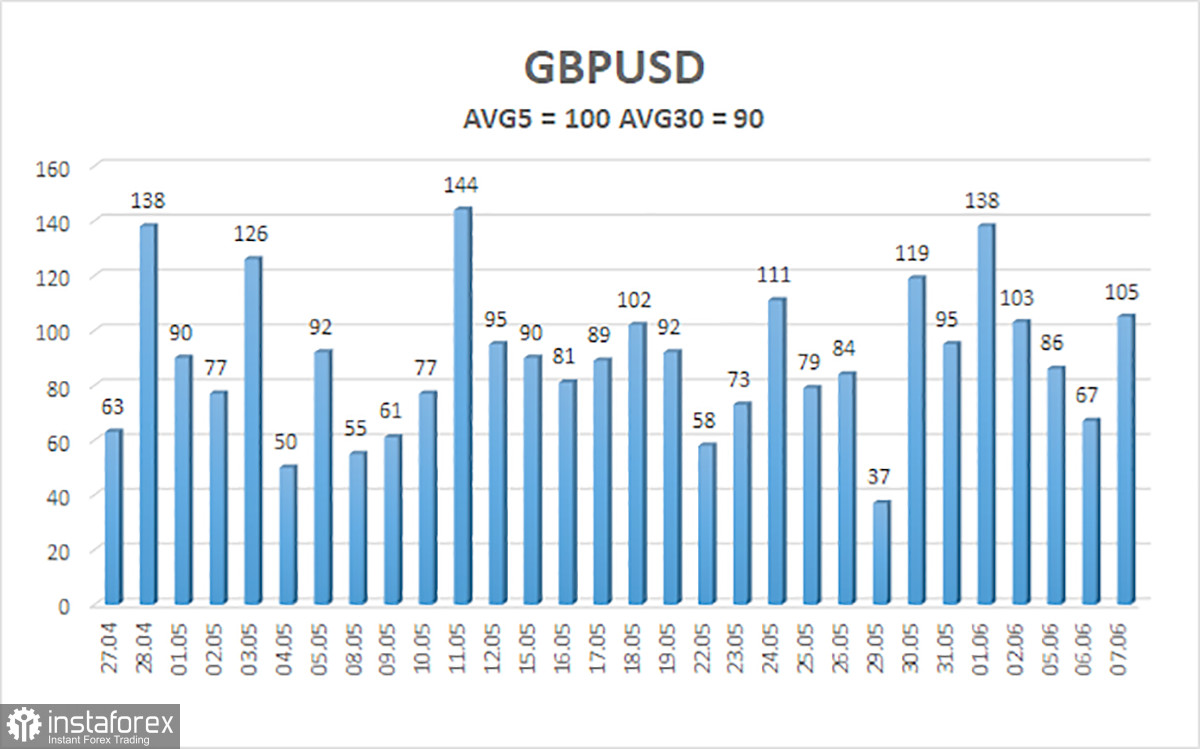
The average volatility of the GBP/USD pair for the past five trading days is 100 pips. For the pound/dollar pair, this value is considered "average." Therefore, on Thursday, June 8th, we expect movements within a range limited by the levels of 1.2339 and 1.2539. Returning the Heiken Ashi indicator downwards will signal a new downward movement.
Nearest support levels:
S1 - 1.2421
S2 - 1.2390
S3 - 1.2360
Nearest resistance levels:
R1 - 1.2451
R2 - 1.2482
R3 - 1.2512
Trading recommendations:
On the 4-hour timeframe, the GBP/USD pair has settled back above the moving average line, so long positions are currently relevant with targets at 1.2482 and 1.2512, which should be considered until the Heiken Ashi indicator reverses downwards. Short positions can be considered if the price consolidates below the moving average with targets at 1.2390 and 1.2360. Currently, there is also a high probability of swings.
Explanations for the illustrations:
Linear regression channels - help determine the current trend. If both channels point in the same direction, it indicates a strong trend.
Moving average line (settings 20.0, smoothed) - determines the short-term trend and the direction in which trading should be conducted.
Murray levels - target levels for movements and corrections.
Volatility levels (red lines) - the probable price channel in which the pair will move in the next 24 hours, based on current volatility indicators.
CCI indicator - its entry into the oversold area (below -250) or overbought area (above +250) indicates an upcoming trend reversal in the opposite direction.
InstaForex analytical reviews will make you fully aware of market trends! Being an InstaForex client, you are provided with a large number of free services for efficient trading.


