 Stay
Stay 
Trading Conditions
Products
Tools


The macroeconomic calendar was empty, which means the absence of important statistical data usually published in Europe, the United Kingdom, and the United States. In such situations, market participants may pay special attention to other sources of information, such as news, statements from central bank representatives, or political events that can affect financial markets. The absence of important statistical data can lead to more active reactions to such information and an increase in speculative activity.
A good example was the speech of European Central Bank Governing Council member Klaas Knot, who pointed out that the ECB may continue to raise interest rates due to the high level of inflation in the eurozone. He expressed concern about the ongoing high level of inflation and noted that further interest rate hikes may be necessary. Knot also highlighted that the eurozone is facing secondary effects from the increase in energy prices, which makes it difficult to achieve the ECB's target inflation rate of 2%. These statements can influence decisions and forecasts regarding ECB policy and affect the positions and potential growth of the euro.
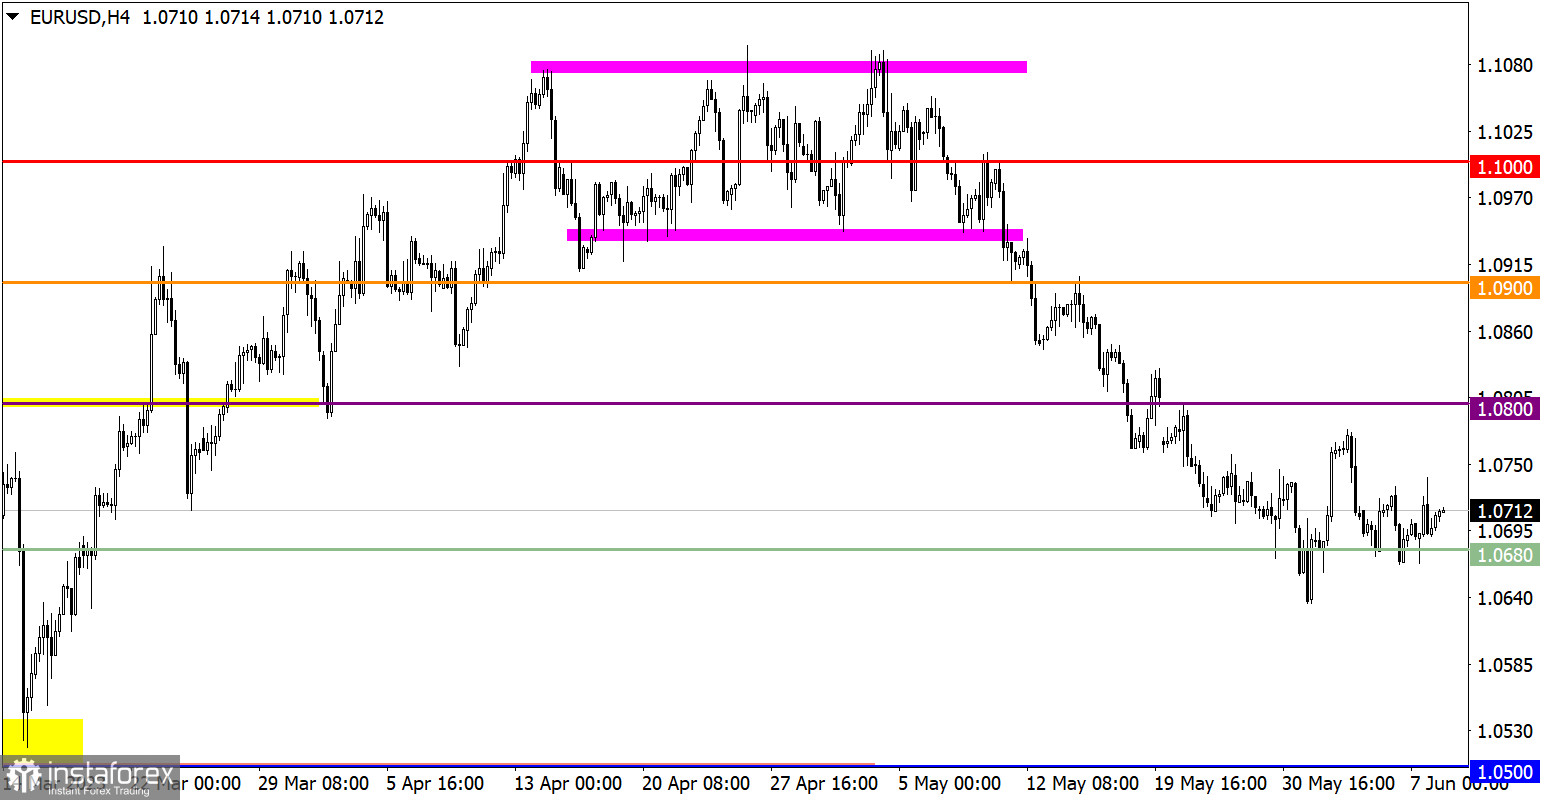
EUR/USD demonstrated a local surge in long positions activity, but this price fluctuation did not lead to significant changes. The quote is still within a characteristic sideways range.
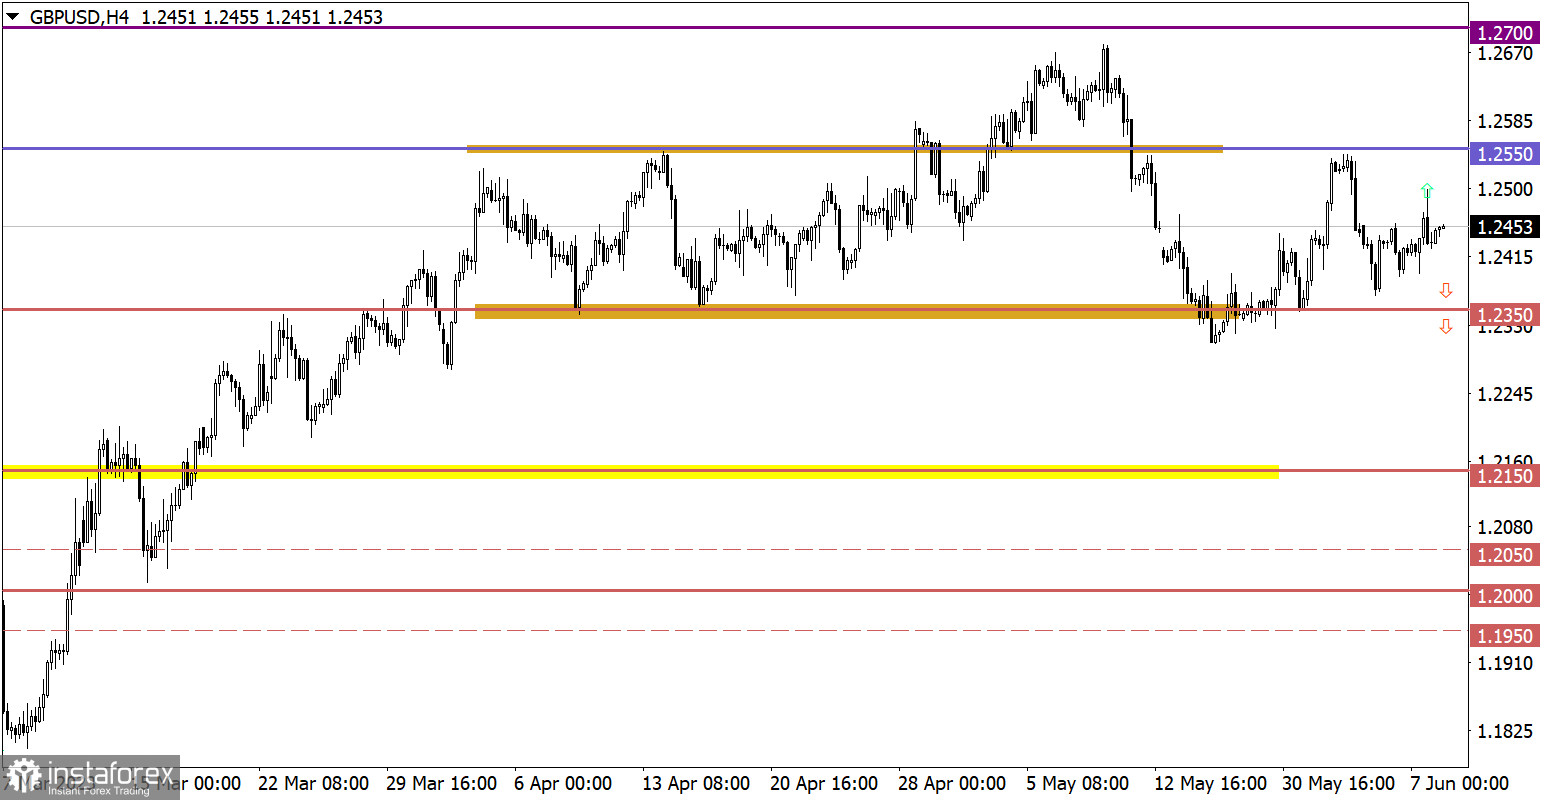
GBP/USD reached the level of 1.2500, where there was a reduction in the volume of long positions. This led to a reversal, bringing the quote back to the opening levels of the trading day.

The publication of GDP data for the EU for the first quarter is expected, but the market reaction may be limited as these indicators have already been preliminarily estimated and known.
Market participants will focus on data on U.S. jobless claims, where an overall increase in the number of claims is predicted. Statistical data details indicate that the volume of continuing claims may rise from 1.795 million to 1.8 million, while initial claims may rise from 232,000 to 235,000.
Time targeting:
U.S. Jobless Claims - 12:30 UTC
In this situation, there is a slowdown in the corrective cycle from the medium-term trend's peak, which may indicate a shift in trading interests among market participants. In order for a primary technical signal of an increase in long positions volume to occur, the quote needs to stay above the value of 1.0750, at least in the four-hour timeframe. As for the downward scenario, a sustained price below the value of 1.0660 may lead to the continuation of the current corrective movement in the market.
Despite maintaining the quote above the value of 1.2450, there are currently no radical changes on the trading chart. However, the sideways price cycle tends to move upwards. Therefore, in case of a repeated touch of the level 1.2500, a new wave of growth in long positions volume may occur, leading to a movement towards the local high of June. As for the downward scenario, if the price returns below the value of 1.2390, a new attempt to break the 1.2350 support level may occur.
The candlestick chart type is white and black graphic rectangles with lines above and below. With a detailed analysis of each individual candle, you can see its characteristics relative to a particular time frame: opening price, closing price, intraday high and low.
Horizontal levels are price coordinates, relative to which a price may stop or reverse its trajectory. In the market, these levels are called support and resistance.
Circles and rectangles are highlighted examples where the price reversed in history. This color highlighting indicates horizontal lines that may put pressure on the asset's price in the future.
The up/down arrows are landmarks of the possible price direction in the future.
InstaForex analytical reviews will make you fully aware of market trends! Being an InstaForex client, you are provided with a large number of free services for efficient trading.


