 Stay
Stay 
Trading Conditions
Products
Tools


Eurozone inflation has slowed down, but not as much as expected. The growth rate of consumer prices was expected to slow down from 2.8% to 2.5%, but it dropped to 2.6%. The difference may seem insignificant, but considering the previous value, it is noticeable. The main thing is that the European Central Bank could use this as a reason to postpone the rate cut. In theory, this could have been a reason for the market to come out of the flat phase.
However, the single currency only moved towards the upper boundary of the range in which it has been trading in for almost two weeks. This is despite the fact that the unemployment rate in Europe decreased from 6.5% to 6.4%. In other words, two key macroeconomic indicators clearly indicate that the euro could rise, but this isn't enough to set the market in motion. Apparently, market players need US reports for that. However, today, the economic calendar is empty. In line with what has been happening in the last couple of weeks, we expect the market to gradually move towards the lower boundary of the range.
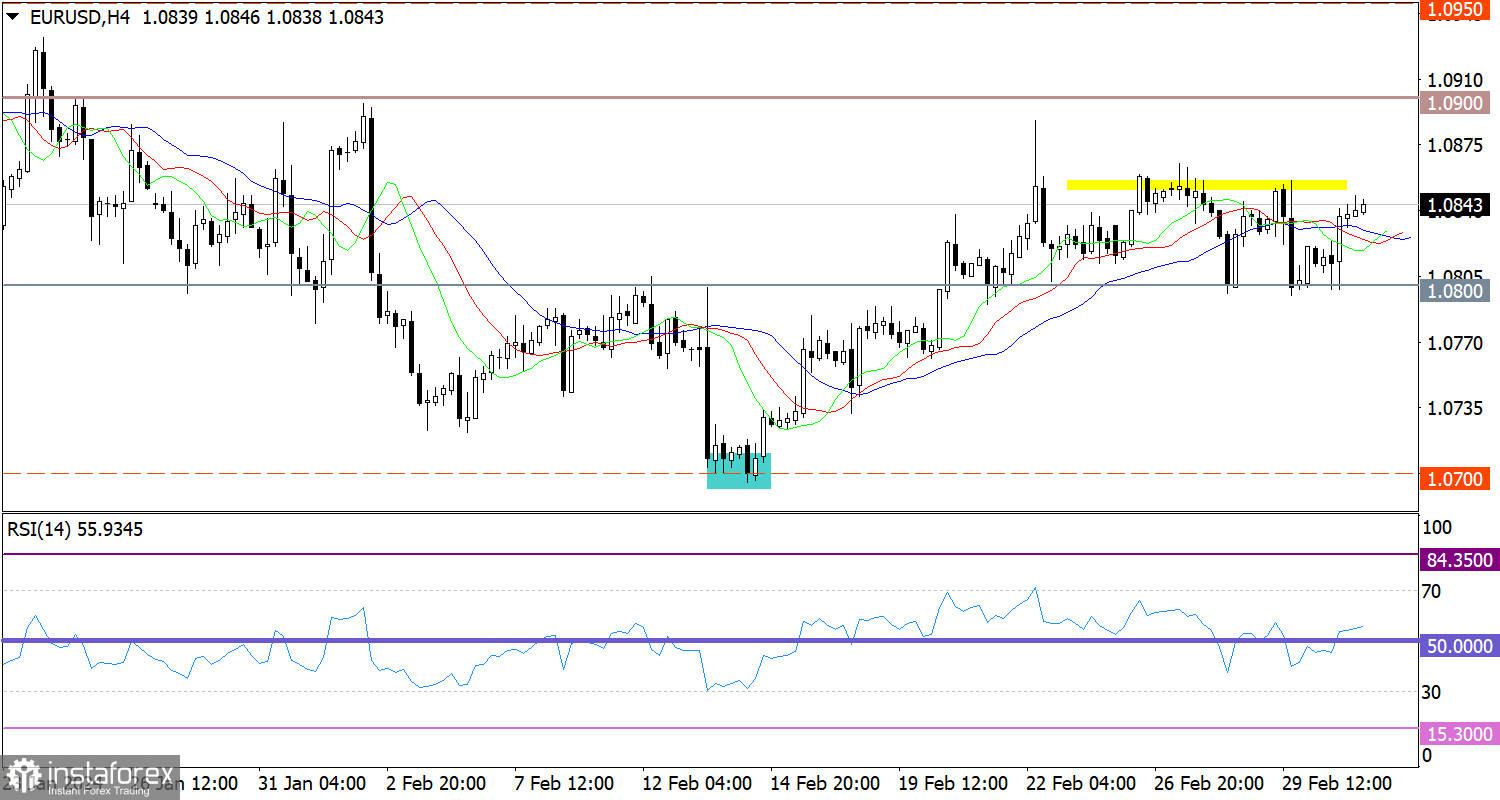
EUR/USD has been trading within the 1.0800/1.0850 range for about a week, showing moderate volatility. Based on the dynamics, we can say that there is a process of a buildup in trading forces.
On the four-hour chart, the RSI technical indicator is hovering in the upper area of 50/70. Take note that at the moment, the indicator's movement is comparable to the price fluctuations within the range.
Meanwhile, the Alligator's MAs are intertwined in the 4-hour chart, pointing to a flat phase.
In this situation, the best tactic would be to work on a price breakthrough of one or the other boundary of the established range. The end of the flat phase may lead to an increase in volatility.
In terms of complex indicator analysis, an upward movement is likely in the short term and intraday periods, in line with the price approaching the upper boundary of the range.
InstaForex analytical reviews will make you fully aware of market trends! Being an InstaForex client, you are provided with a large number of free services for efficient trading.

