 Stay
Stay 
Trading Conditions
Products
Tools


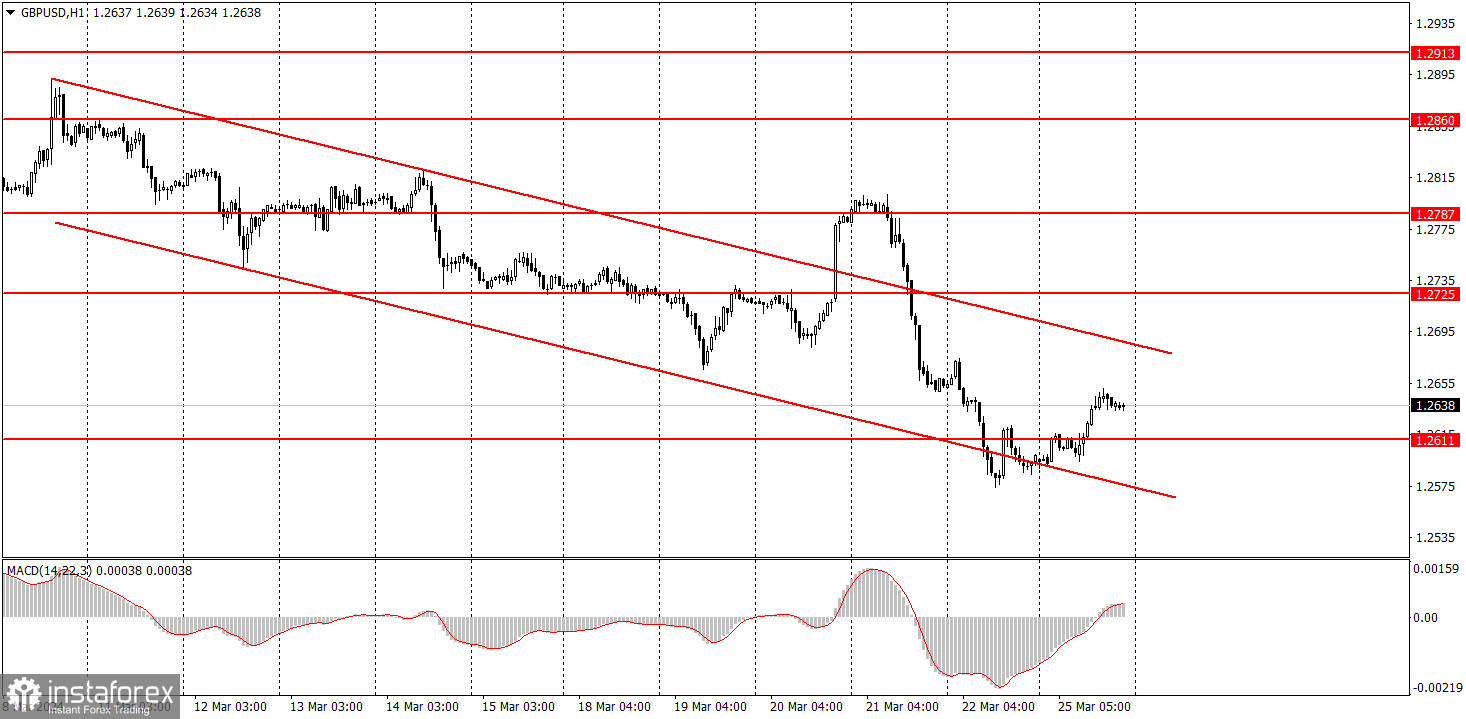
The GBP/USD pair also experienced a minor correction but remained within the descending channel. Thus, the downtrend persists. Take note that we do not consider the quotes movement beyond the channel boundaries that happened last week, as it occurred immediately after the FOMC meeting when the market was trading on emotions. However, we still expect the pound to fall.
On Monday, there were no significant events in the UK and the US, but it wasn't just another "boring Monday." Volatility was not high, but it was not low either. Novice traders could consider new bearish opportunities. The price was approaching the upper boundary of the descending channel, from which a bounce may occur. In addition, traders could consider selling the pair if it consolidates below the level of 1.2611, which has long served as strong support for the pound.
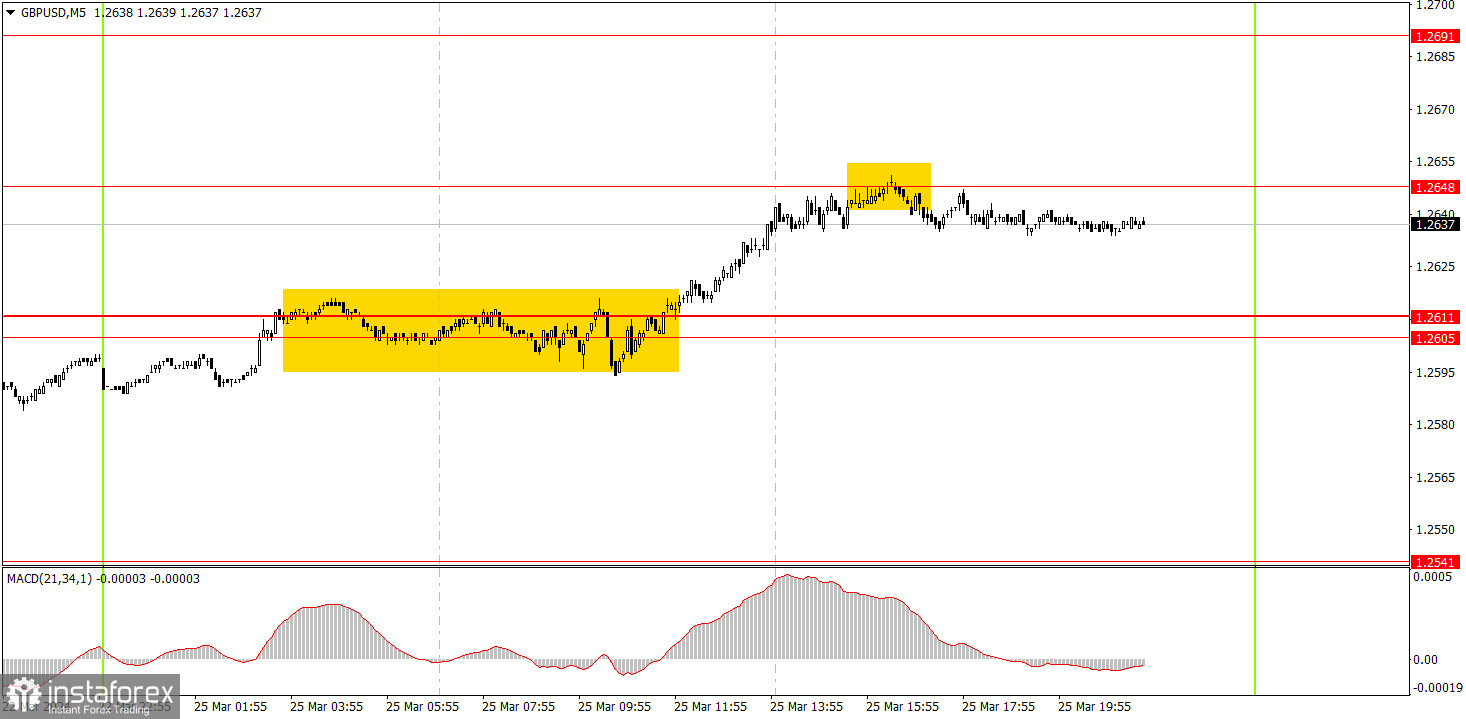
Two trading signals were generated on the 5-minute timeframe, both of which left much to be desired. Initially, the pair remained in the range of 1.2605-1.2611 for a long time, and it only managed to break above it closer to the US session. At this point, beginners could open long positions. During the US session, the level of 1.2648 was tested with a bounce. Here, it was advisable to close long positions and open short ones. Profit from long positions amounted to about 15 pips. After opening short positions, the pair hardly moved, so the profit could be a maximum of 5 pips. The day's movements were far from the strongest and could hardly be considered a trend...
On the hourly chart, GBP/USD has resumed its downward movement. Unfortunately, the market continues to trade erratically quite often, which at the very least confuses traders, especially beginners. Nevertheless, the British currency has been declining in recent days and weeks, which is encouraging. The downtrend remains intact.
On Tuesday, you may consider short positions and wait for sell signals. You may disregard the bearish scenario in case the price consolidates above the descending channel. In this case, you may opt for longs, and expect a new illogical rise.
The key levels on the 5M chart are 1.2372-1.2387, 1.2457, 1.2502, 1.2544, 1.2605-1.2611, 1.2648, 1.2691, 1.2725, 1.2787-1.2791, 1.2848-1.2860, 1.2913, 1.2981-1.2993. On Tuesday, there are no scheduled events in the UK. We will only highlight the US report on durable goods orders.
1) Signal strength is determined by the time taken for its formation (either a bounce or level breach). A shorter formation time indicates a stronger signal.
2) If two or more trades around a certain level are initiated based on false signals, subsequent signals from that level should be disregarded.
3) In a flat market, any currency pair can produce multiple false signals or none at all. In any case, the flat trend is not the best condition for trading.
4) Trading activities are confined between the onset of the European session and mid-way through the U.S. session, after which all open trades should be manually closed.
5) On the 30-minute timeframe, trades based on MACD signals are only advisable amidst substantial volatility and an established trend, confirmed either by a trendline or trend channel.
6) If two levels lie closely together (ranging from 5 to 15 pips apart), they should be considered as a support or resistance zone.
Support and Resistance price levels can serve as targets when buying or selling. You can place Take Profit levels near them.
Red lines represent channels or trend lines, depicting the current market trend and indicating the preferable trading direction.
The MACD(14,22,3) indicator, encompassing both the histogram and signal line, acts as an auxiliary tool and can also be used as a signal source.
Significant speeches and reports (always noted in the news calendar) can profoundly influence the price dynamics. Hence, trading during their release calls for heightened caution. It may be reasonable to exit the market to prevent abrupt price reversals against the prevailing trend.
Beginners should always remember that not every trade will yield profit. Establishing a clear strategy coupled with sound money management is the cornerstone of sustained trading success.
InstaForex analytical reviews will make you fully aware of market trends! Being an InstaForex client, you are provided with a large number of free services for efficient trading.

