 Stay
Stay 
Trading Conditions
Products
Tools


EUR/USD continued to trade in a sluggish and reluctant manner on Tuesday. For the second day in a row, volatility was around 40 pips, which is low even for the euro. However, traders should already be used to such conditions, as we've seen something similar in the market over the past couple of months. At the end of last week, we saw a spike in volatility, thanks to the Bank of England and the Federal Reserve. But it was clear that with the start of the new week, volatility levels would return to their previous levels.
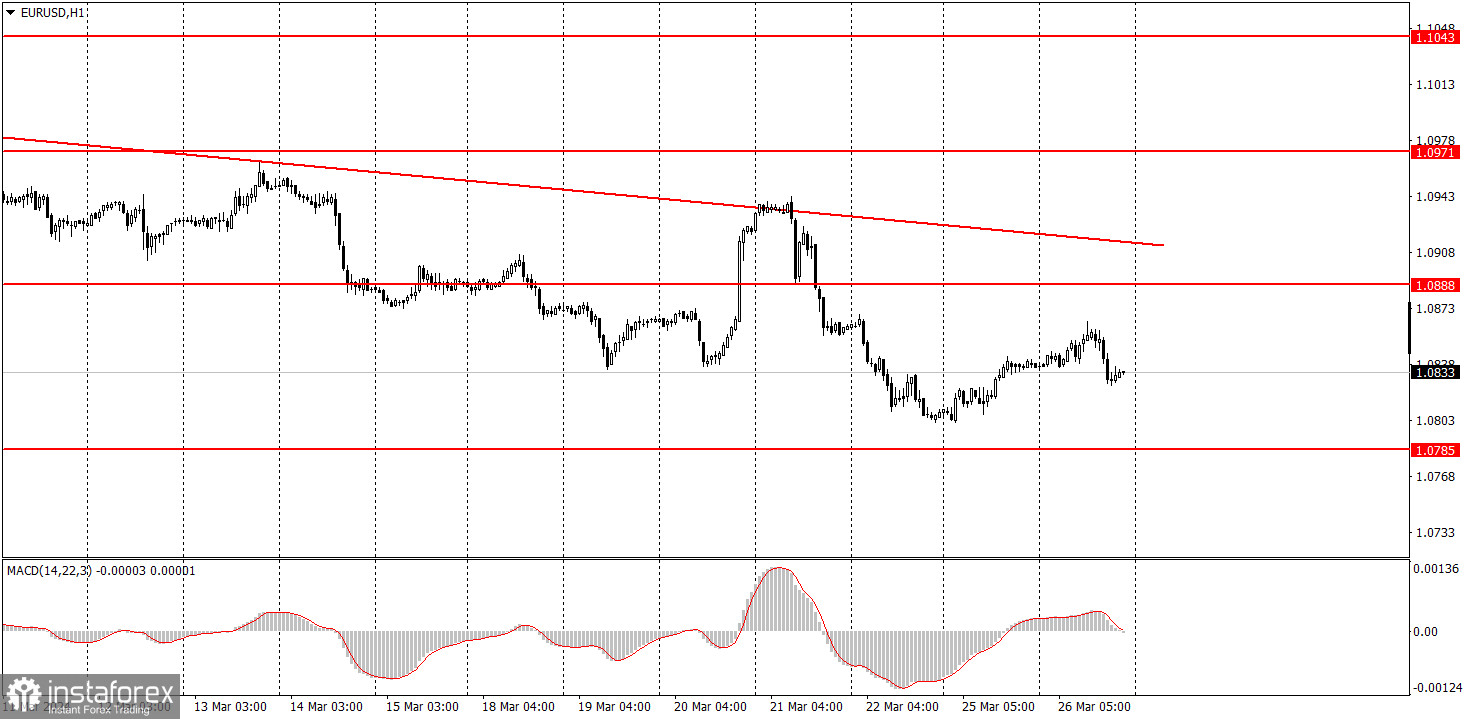
The descending trendline remains relevant but has too shallow of an angle, which perfectly illustrates the strength of the current trend. Data on US durable goods orders was published on Tuesday, which did not provoke any significant market reaction. Meanwhile, the euro area economic calendar was relatively quiet. Moving forward, we expect the pair to trade with low volatility and no clear defined direction until the end of the week.
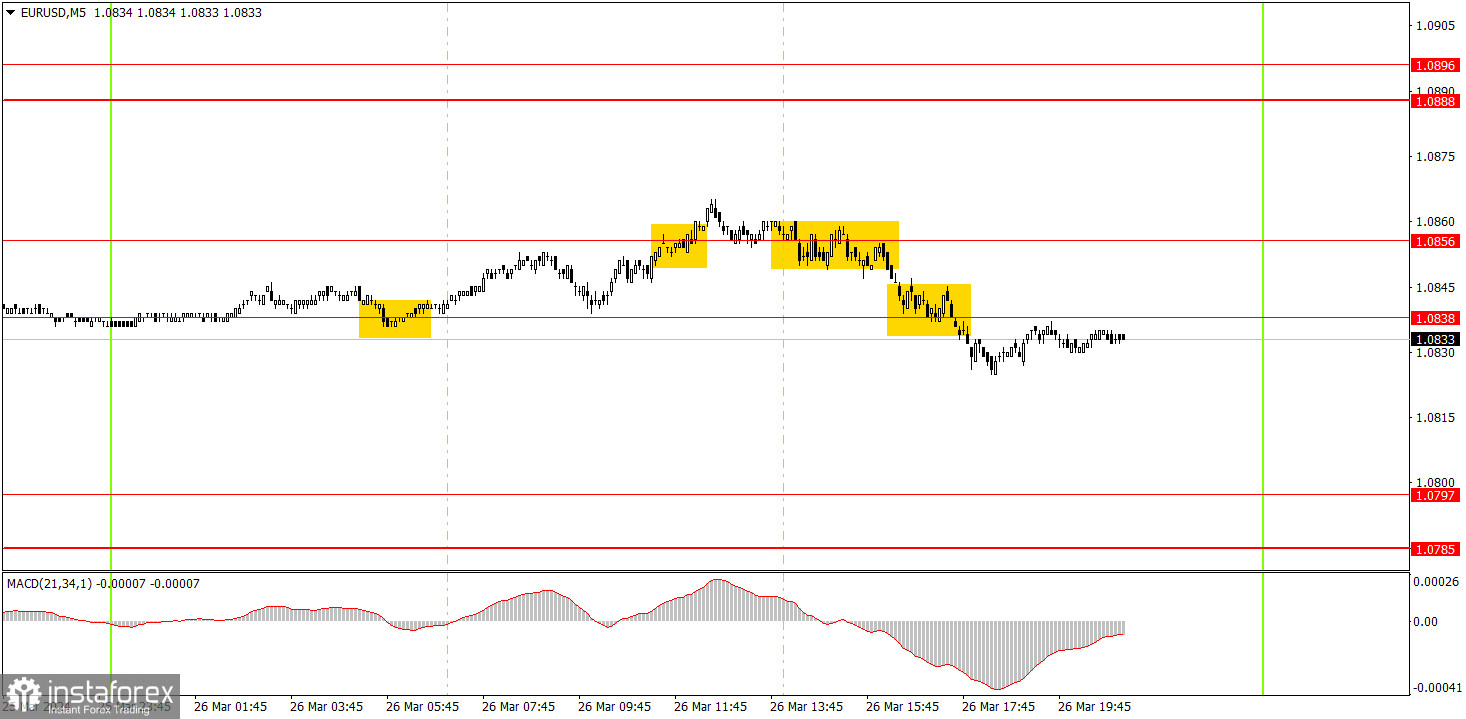
Several trading signals were generated on the 5-minute timeframe, but none of them brought substantial profit due to weak movements. Initially, the pair bounced off the level of 1.0838 and surpassed the level of 1.0956. When the price settled back below the level of 1.0956, long positions could be closed. The profit from this trade was literally a couple of pips. Immediately after, short positions could be opened, which could be closed manually closer to the evening. This was the only way to make some profit. In total, about 15 pips of profit were made, which is still quite decent considering the strength of the current movements.
On the hourly chart, EUR/USD continues to move downward, which corresponds to the fundamental background. We believe that the euro should fall anyway, as the price is still too high, and the global trend is downward. Unfortunately, the market doesn't always want to trade the pair in a logical manner, and from time to time, we observe unreasonable growth. Moreover, the movements are quite weak.
The key levels on the 5M chart are 1.0568, 1.0611-1.0618, 1.0668, 1.0725, 1.0785-1.0797, 1.0838, 1.0856, 1.0888-1.0896, 1.0940, 1.0971-1.0981, 1.1011, 1.1043, 1.1091. On Wednesday, there are no important reports or events scheduled in the European Union and the United States. We will likely see very weak movements and the market will probably be hesitant to trade the pair.
1) Signal strength is determined by the time taken for its formation (either a bounce or level breach). A shorter formation time indicates a stronger signal.
2) If two or more trades around a certain level are initiated based on false signals, subsequent signals from that level should be disregarded.
3) In a flat market, any currency pair can produce multiple false signals or none at all. In any case, the flat trend is not the best condition for trading.
4) Trading activities are confined between the onset of the European session and mid-way through the U.S. session, after which all open trades should be manually closed.
5) On the 30-minute timeframe, trades based on MACD signals are only advisable amidst substantial volatility and an established trend, confirmed either by a trendline or trend channel.
6) If two levels lie closely together (ranging from 5 to 15 pips apart), they should be considered as a support or resistance zone.
Support and Resistance price levels can serve as targets when buying or selling. You can place Take Profit levels near them.
Red lines represent channels or trend lines, depicting the current market trend and indicating the preferable trading direction.
The MACD(14,22,3) indicator, encompassing both the histogram and signal line, acts as an auxiliary tool and can also be used as a signal source.
Significant speeches and reports (always noted in the news calendar) can profoundly influence the price dynamics. Hence, trading during their release calls for heightened caution. It may be reasonable to exit the market to prevent abrupt price reversals against the prevailing trend.
Beginning traders should always remember that not every trade will yield profit. Establishing a clear strategy coupled with sound money management is the cornerstone of sustained trading success.
InstaForex analytical reviews will make you fully aware of market trends! Being an InstaForex client, you are provided with a large number of free services for efficient trading.

