 Stay
Stay 
Trading Conditions
Products
Tools


On Thursday, data on the EU producer price index was published. The annual rate of decline in factory inflation escalated from -8.0% to -8.3% in March, but this happened only due to an upward revision of previous data, from -8.6%. At the same time, the revision of previous data indicates a further stabilization of inflation processes. It suggests that the ECB will be the first to begin cutting interest rates. The main lever for speculative activity was the remarks of several Fed representatives, who unanimously signaled that the market should not expect an early reduction in interest rates. This information background led to a fall in Wall Street indices and, as a result, strengthened the US dollar.
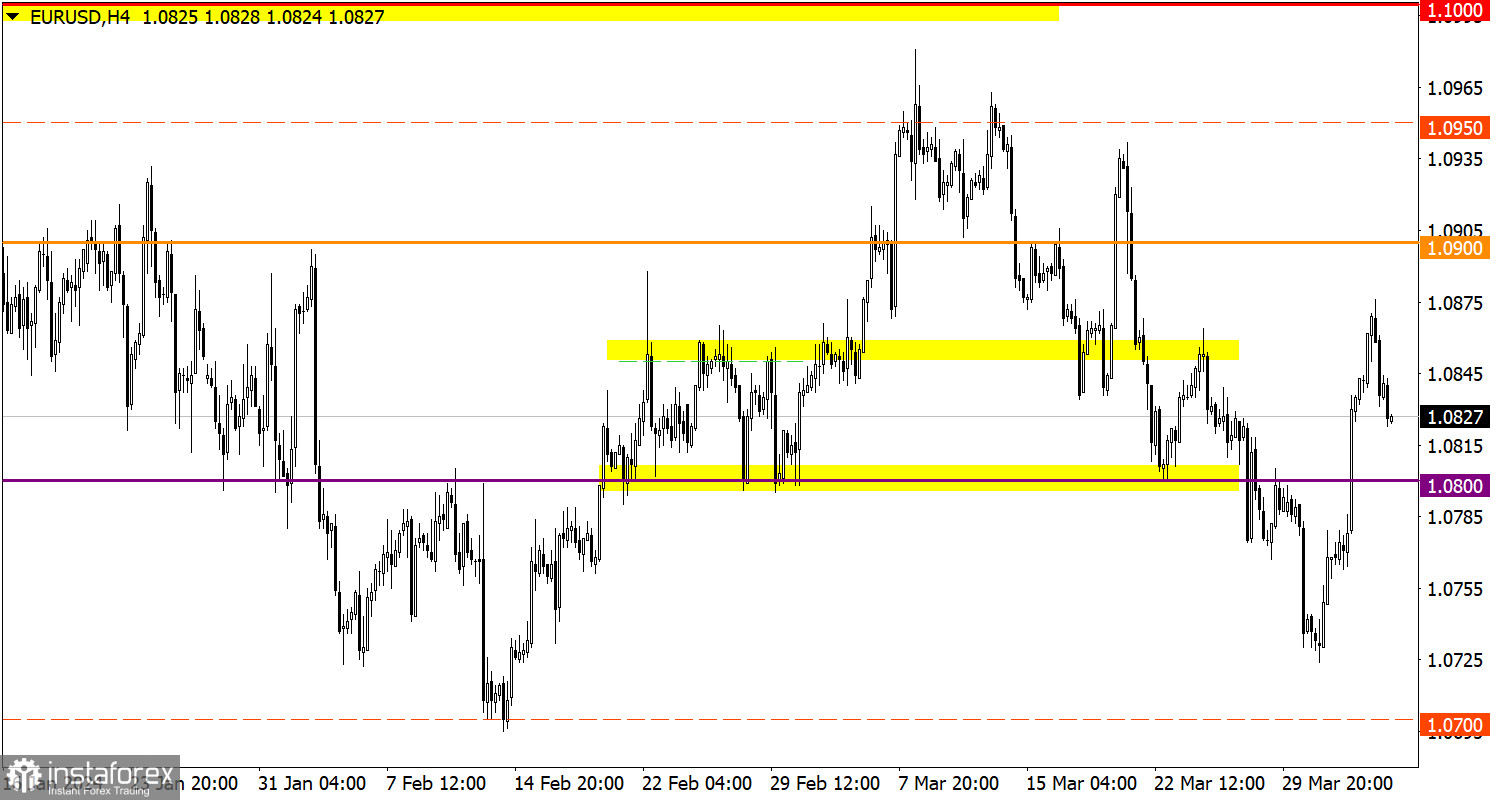
The cycle of inertial-speculative movement for the EUR/USD pair was interrupted around the level of 1.0875 where the volume of long positions rapidly decreased. The cause and effect of the reversal is due to the Fed's information flow. From the point of technical analysis, we can only add that the euro has been overbought in recent days.
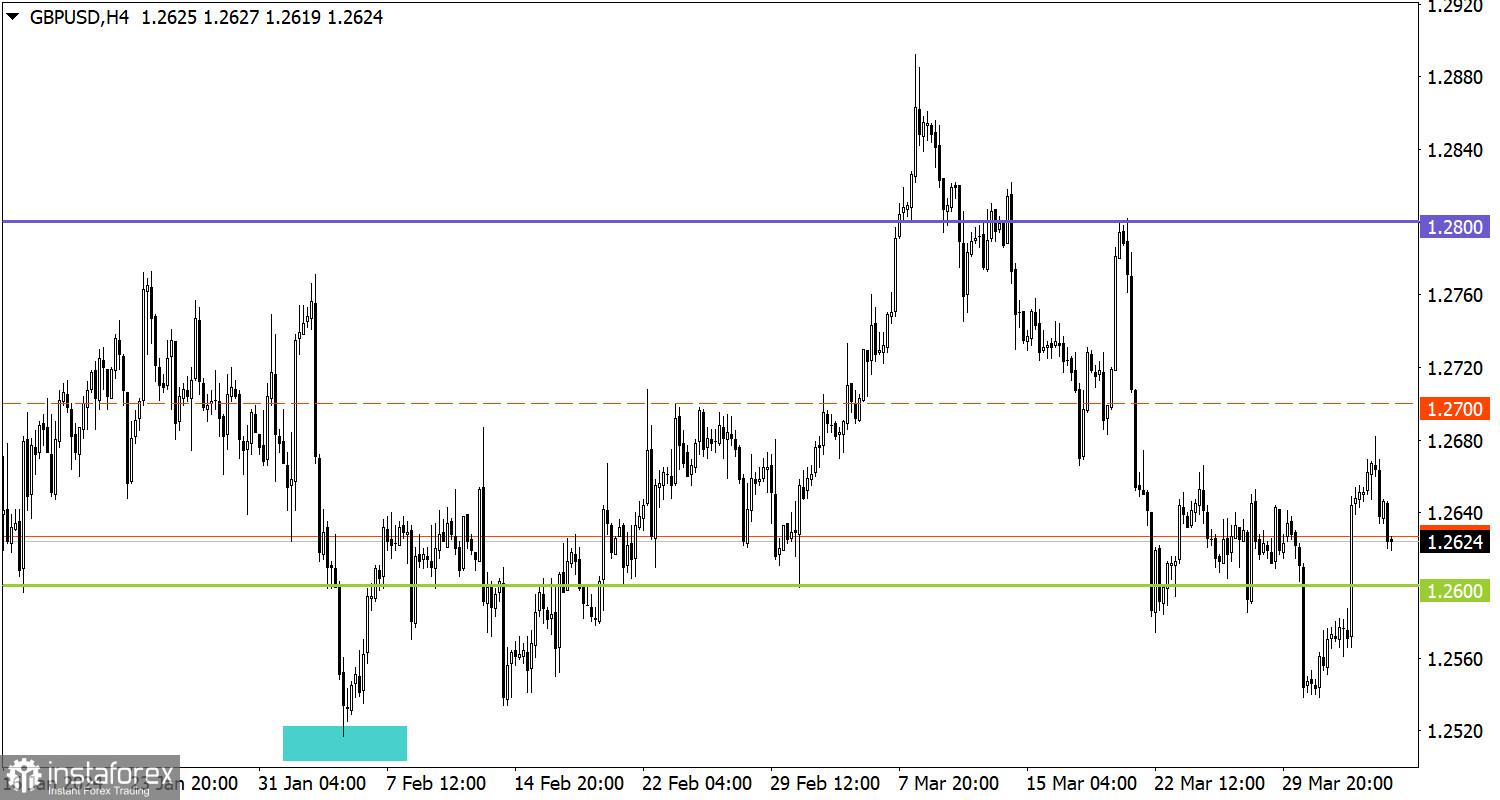
A similar picture is valid for the GBP/USD pair. The upward cycle was also interrupted. The reason lies in the increase in the volume of dollar positions in the market. As a result, the overbought pound sterling began a downward retracement.

Today, the nonfarm payrolls from the US Department of Labor are due to be published. The US private sector may record an increase in new non-agricultural jobs by 275K, which is enough to maintain a stable labor market. This, in turn, may indicate a possible decline in the unemployment rate, which is already at an unusually low level for the American economy. In such a situation, reducing interest rates could entail both overheating of the labor market and sharp unwinding of the inflationary spiral. Thus, the Federal Reserve may well delay the cycle of easing monetary policy, which will lead to a further strengthening of the US dollar.
If the bearish sentiment for the euro continues in the market, EUR/USD may well drop to the level of 1.0800. For subsequent growth in the volume of short positions, the price should settle below this level at the end of the week. As for the upward move, it will be implemented by traders when one of the possible scenarios occurs. The first is a rebound from the level of 1.0800, which will lead to a slowdown in the downward cycle and an increase in the volume of long positions. The second scenario suggests the possibility of a slowdown in the downward cycle. A return of the price above 1.0850 may already indicate an increase in the volume of long positions in EUR/USD.
In this situation, a positive background for the US dollar still exists in the market. For this reason, we cannot exclude a possible price move at least to 1.2600. For a subsequent increase in the volume of short positions in the pound sterling, the price must settle below this level at the end of the week. As for the upward scenario, the level of 1.2600 is considered by traders as support, which allows for the possibility of a rebound in case the instrument approaches this level.
The candlestick chart type consists of graphic rectangles in white and black with lines at the top and bottom. With a detailed analysis of each individual candle, you can see its characteristics relative to a particular time period: opening price, closing price, maximum and minimum price.
Horizontal levels are price coordinates relative to which a price may stop or revered its trajectory. In the market, these levels are called support and resistance.
Circles and rectangles are highlighted examples where the price developed. This color highlighting indicates horizontal lines that may put pressure on the price in the future.
Up/down arrows are guidelines for a possible future trajectory.
InstaForex analytical reviews will make you fully aware of market trends! Being an InstaForex client, you are provided with a large number of free services for efficient trading.


