 Stay
Stay 
Trading Conditions
Products
Tools


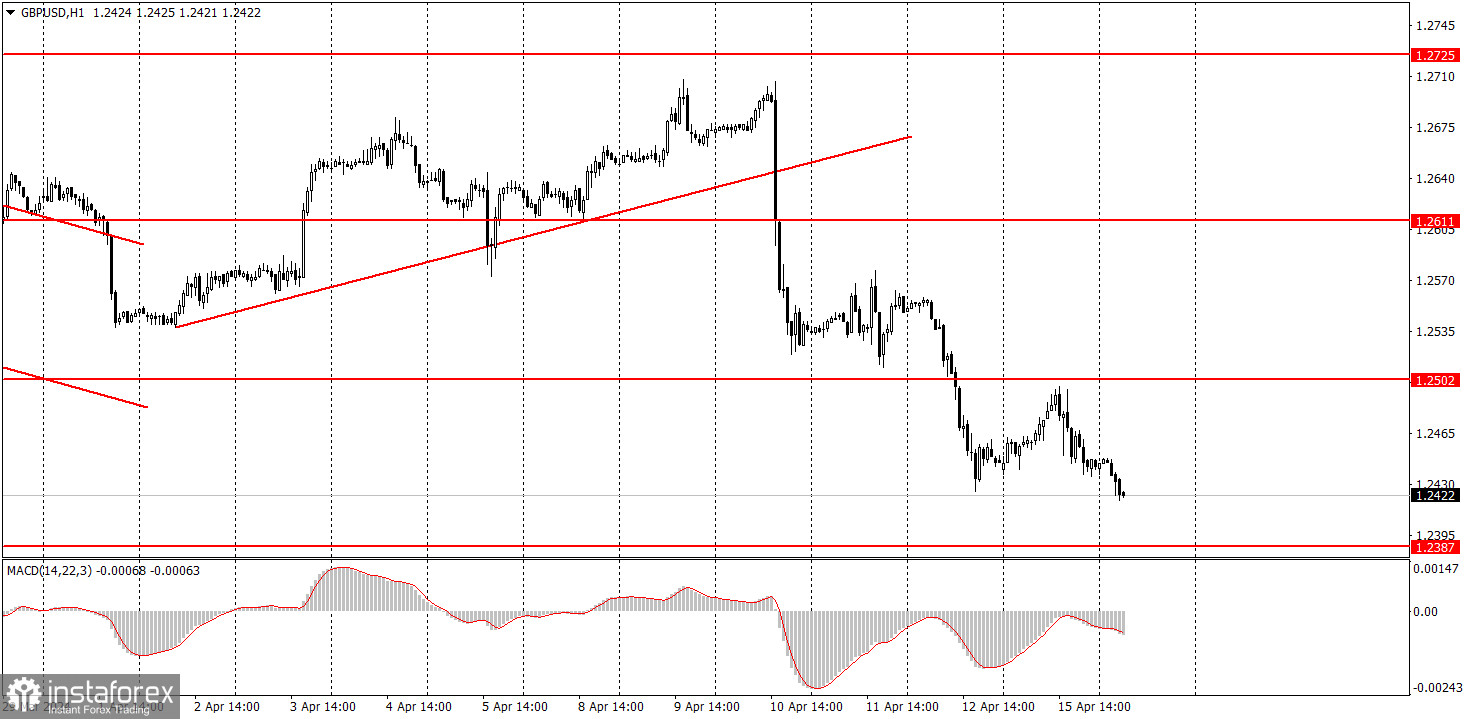
The GBP/USD pair also tried to start a minor bullish correction on Monday, but the downward movement resumed in the second half of the day. Take note that a significant event occurred last week – the pair left the 4-month sideways channel and may now begin forming a strong downtrend. There were concerns that the new week would start with another illogical rise from the pound, but so far they have not been justified. The British pound should fall along with the euro, as there are many more reasons for the US dollar to rise.
The key reason for the pair's decline is the Federal Reserve's hawkish policy, while the market has been expecting monetary easing from the US central bank. These hopes have not been justified, as inflation in the United States is rising. At the same time, inflation in the United Kingdom could reach 3% this week, which would give the Bank of England the opportunity to begin discussing the timing of the first policy easing.
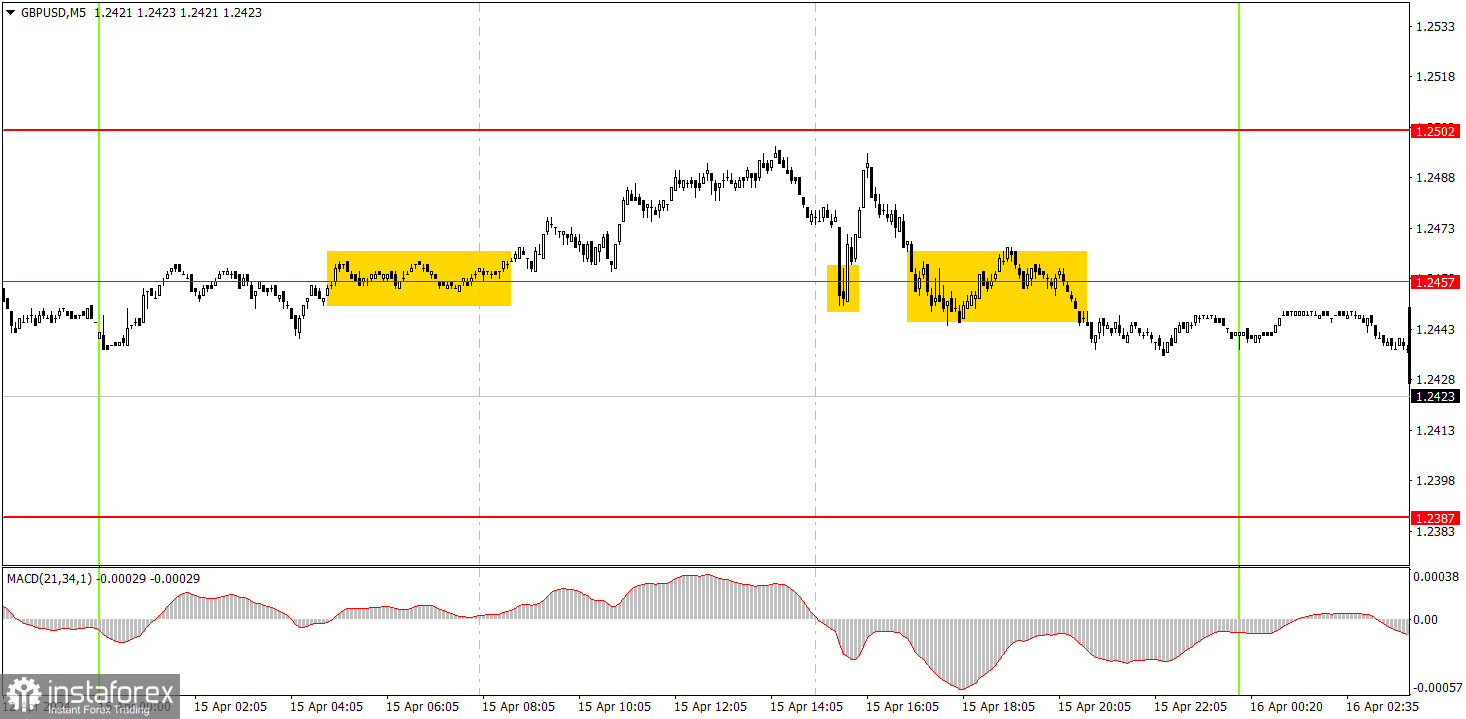
The movements and trading signals on the 5-minute timeframe were not the best. During the European trading session, a buy signal was formed around the level of 1.2457, but the price failed to reach the target level of 1.2502 by just a few pips. Subsequently, there was a rebound from the level of 1.2457, but the price failed to reach the target level once again. Therefore, the first two signals could be considered false signals, and the third signal around the level of 1.2457 should not have been executed. Profit from both trades could only be obtained if the trades were manually closed.
On the hourly chart, the GBP/USD pair finally has real technical grounds to end the 4-month flat phase. After surpassing the level of 1.2502, traders may expect a new downward trend. The fundamental and macroeconomic backdrop continues to support the dollar to a much greater extent than the British one. Therefore, we only expect downward movements from the pair.
On Tuesday, novice traders can look for sell signals below the level of 1.2502. A correction may follow, but it is unlikely to be a strong movement. If the price does not return above the level of 1.2502 in the near future, the chances of forming a downward trend will increase even more.
The key levels on the 5M chart are 1.2270, 1.2310, 1.2372-1.2387, 1.2457, 1.2502, 1.2544, 1.2605-1.2611, 1.2648, 1.2691, 1.2725, 1.2787-1.2791. Today, the UK will release reports on unemployment, unemployment claims, and average earnings. These data may affect the pair's movement, but the downtrend is expected to persist. The US will only publish minor reports.
1) Signal strength is determined by the time taken for its formation (either a bounce or level breach). A shorter formation time indicates a stronger signal.
2) If two or more trades around a certain level are initiated based on false signals, subsequent signals from that level should be disregarded.
3) In a flat market, any currency pair can produce multiple false signals or none at all. In any case, the flat trend is not the best condition for trading.
4) Trading activities are confined between the onset of the European session and mid-way through the U.S. session, after which all open trades should be manually closed.
5) On the 30-minute timeframe, trades based on MACD signals are only advisable amidst substantial volatility and an established trend, confirmed either by a trendline or trend channel.
6) If two levels lie closely together (ranging from 5 to 15 pips apart), they should be considered as a support or resistance zone.
Support and Resistance price levels can serve as targets when buying or selling. You can place Take Profit levels near them.
Red lines represent channels or trend lines, depicting the current market trend and indicating the preferable trading direction.
The MACD(14,22,3) indicator, encompassing both the histogram and signal line, acts as an auxiliary tool and can also be used as a signal source.
Significant speeches and reports (always noted in the news calendar) can profoundly influence the price dynamics. Hence, trading during their release calls for heightened caution. It may be reasonable to exit the market to prevent abrupt price reversals against the prevailing trend.
Beginners should always remember that not every trade will yield profit. Establishing a clear strategy coupled with sound money management is the cornerstone of sustained trading success.
InstaForex analytical reviews will make you fully aware of market trends! Being an InstaForex client, you are provided with a large number of free services for efficient trading.


