 Stay
Stay 
Trading Conditions
Products
Tools


The GBP/USD pair generally maintained a downward bias on Tuesday and it even edged down. The UK released three relatively important reports, but it is difficult to highlight which one was the most significant. The unemployment rate rose to 4.2%, although it was forecasted to be no more than 4.0%. Average earnings increased by 5.6%, which is in line with forecasts. And the number of jobless claims turned out to be lower than expected. Therefore, we can't confirm whether these reports were disappointing for the pound or, conversely, strong.
In the second half of the day, the US published mixed data as well. Of course, all these reports triggered a minor market reaction, but as we warned you, they did not affect the overall market trend and sentiment. Therefore, the pound may fall further.
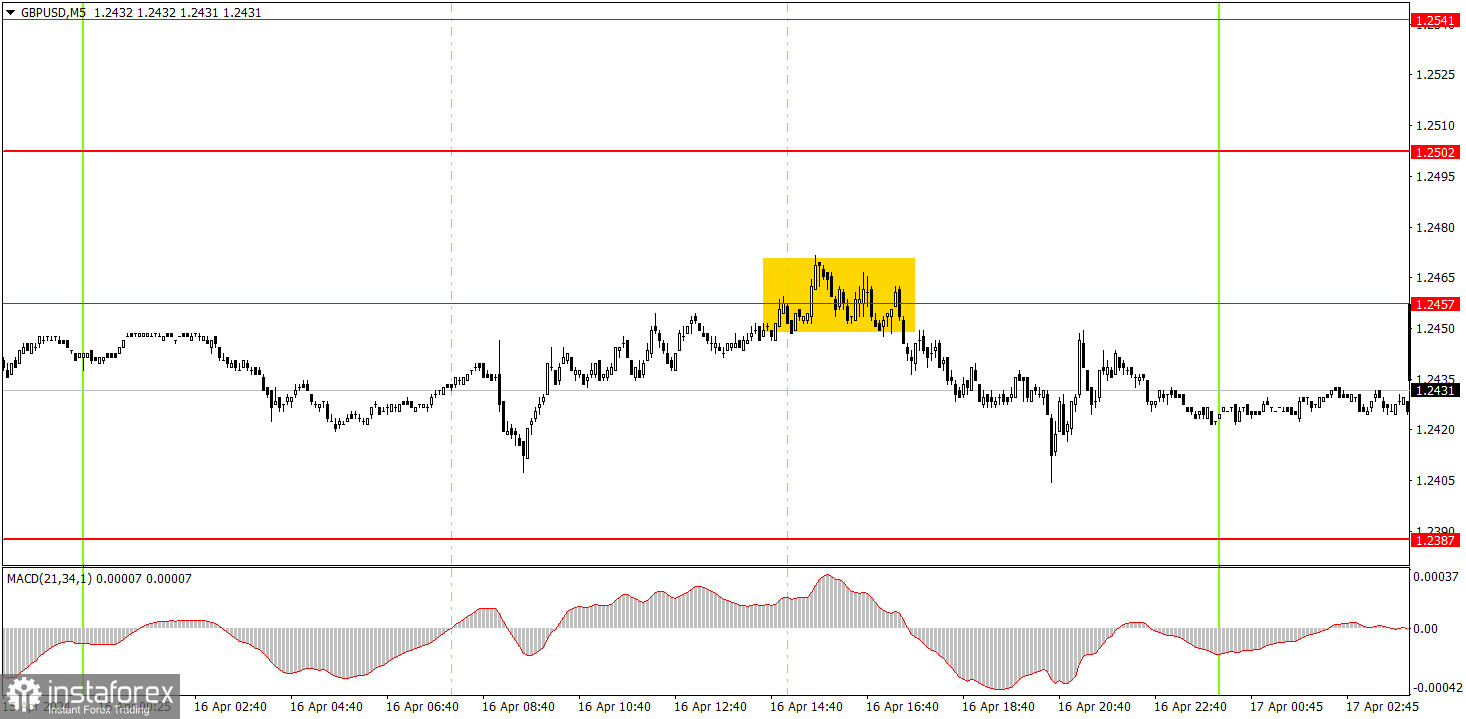
Only one sell signal was formed on the 5-minute timeframe, and it was around the level of 1.2457. The signal was not very accurate, but there were enough price reversals during the day due to the significant amount of macro data. After the signal was formed, beginners could enter the market with short positions. Overall, the pair fell by about 25-30 pips. The trade should have been manually closed as no other signals were formed. Therefore, it was possible to make a small profit from it.
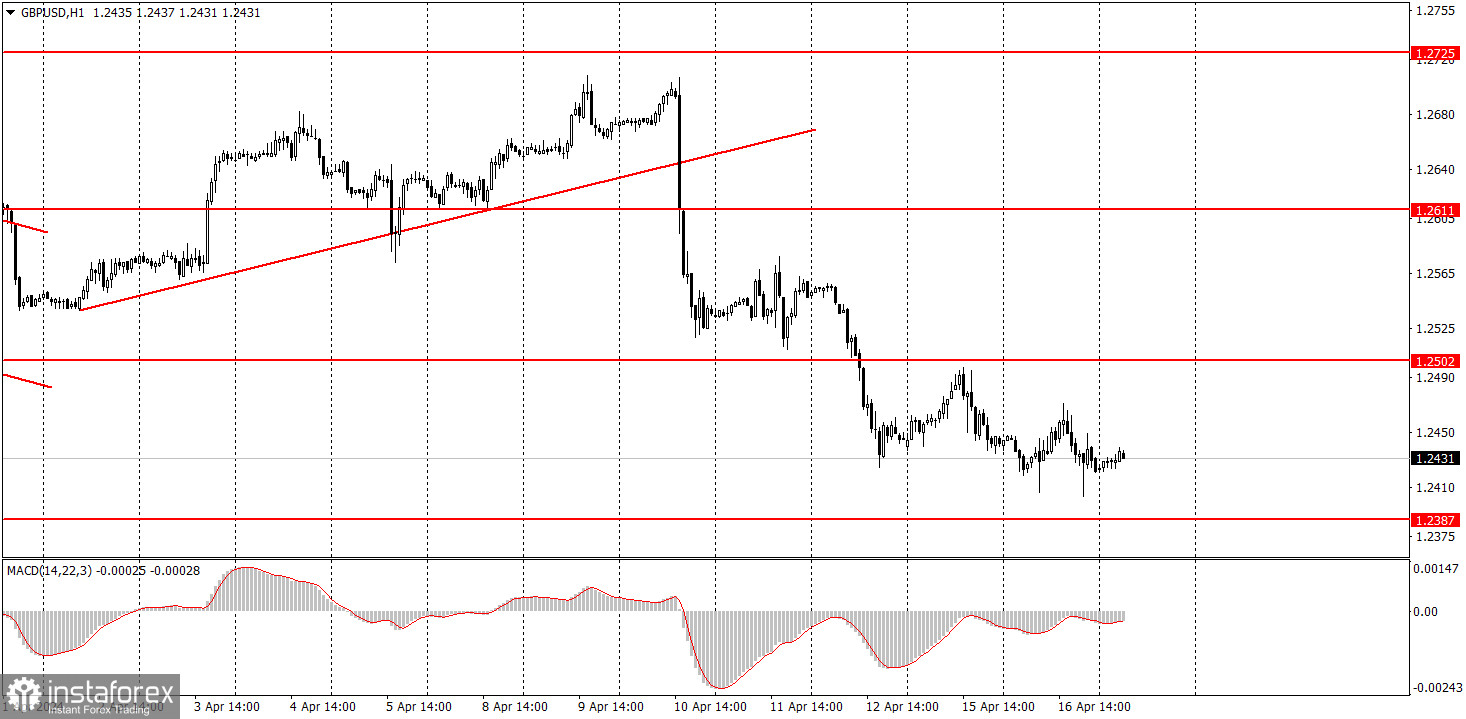
On the hourly chart, the GBP/USD pair finally has real technical grounds for forming a downward trend. After surpassing the level of 1.2502, traders may expect a significant decline from the pound. The fundamental and macroeconomic backdrop continues to support the dollar to a much greater extent than the British one. Therefore, we only expect downward movements from the pair.
On Wednesday, novice traders can look for new sell signals below the level of 1.2502. Short positions can be opened based on yesterday's signal around the level of 1.2457. However, today, the pound will depend on the UK inflation report, which will be released in two hours. The pound can still rise.
The key levels on the 5M chart are 1.2270, 1.2310, 1.2372-1.2387, 1.2457, 1.2502, 1.2544, 1.2605-1.2611, 1.2648, 1.2691, 1.2725, 1.2787-1.2791. The UK Consumer Price Index for March will be published today. This is a crucial report that directly affects the Bank of England's monetary policy, so the market could show a strong reaction. The pound's movement will depend on how much inflation slows down in March.
1) Signal strength is determined by the time taken for its formation (either a bounce or level breach). A shorter formation time indicates a stronger signal.
2) If two or more trades around a certain level are initiated based on false signals, subsequent signals from that level should be disregarded.
3) In a flat market, any currency pair can produce multiple false signals or none at all. In any case, the flat trend is not the best condition for trading.
4) Trading activities are confined between the onset of the European session and mid-way through the U.S. session, after which all open trades should be manually closed.
5) On the 30-minute timeframe, trades based on MACD signals are only advisable amidst substantial volatility and an established trend, confirmed either by a trendline or trend channel.
6) If two levels lie closely together (ranging from 5 to 15 pips apart), they should be considered as a support or resistance zone.
Support and Resistance price levels can serve as targets when buying or selling. You can place Take Profit levels near them.
Red lines represent channels or trend lines, depicting the current market trend and indicating the preferable trading direction.
The MACD(14,22,3) indicator, encompassing both the histogram and signal line, acts as an auxiliary tool and can also be used as a signal source.
Significant speeches and reports (always noted in the news calendar) can profoundly influence the price dynamics. Hence, trading during their release calls for heightened caution. It may be reasonable to exit the market to prevent abrupt price reversals against the prevailing trend.
Beginners should always remember that not every trade will yield profit. Establishing a clear strategy coupled with sound money management is the cornerstone of sustained trading success.
InstaForex analytical reviews will make you fully aware of market trends! Being an InstaForex client, you are provided with a large number of free services for efficient trading.


