 Stay
Stay 
Trading Conditions
Products
Tools


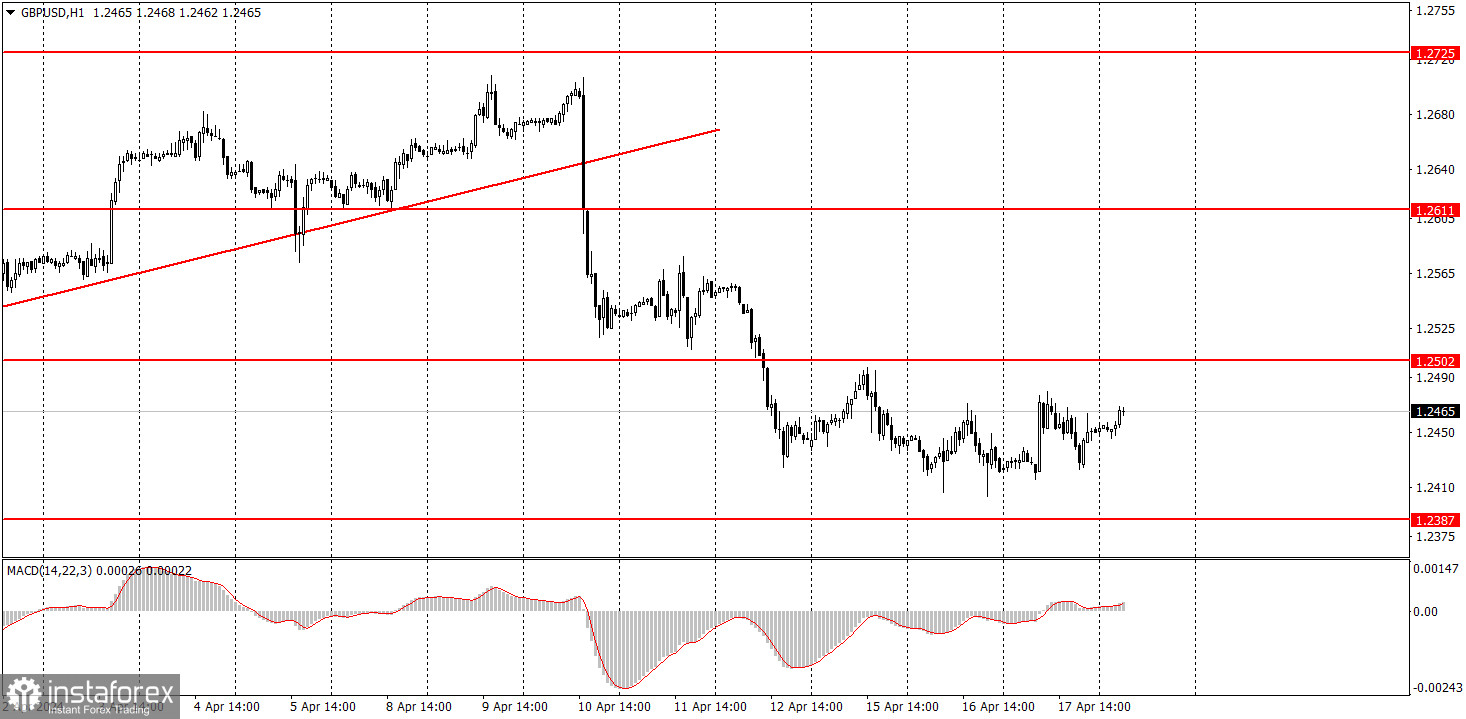
The GBP/USD pair continued to trade sideways on Wednesday. After the price broke out of the 1.25-1.28 sideways channel, the pair suddenly stopped falling. Unfortunately, in this case, the pair may correct higher. We still expect a new downward trend since the pound doesn't have any solid reasons to rise. However, it appears that the market is returning to its previous stance where the pound is untouchable, no matter what happens. The British currency continues to trade in an aloof manner, despite last week's decline.
Yesterday, the Consumer Price Index in the UK showed that inflation decreased to 3.2% in March. In our opinion, this is enough for the pound to continue its downward movement, as it should fall further even without this report. However, the market was disappointed by the fact that inflation did not sharply fall, although the Bank of England is now closer to the first monetary policy easing than the Federal Reserve. So for now, the aloofness persists.
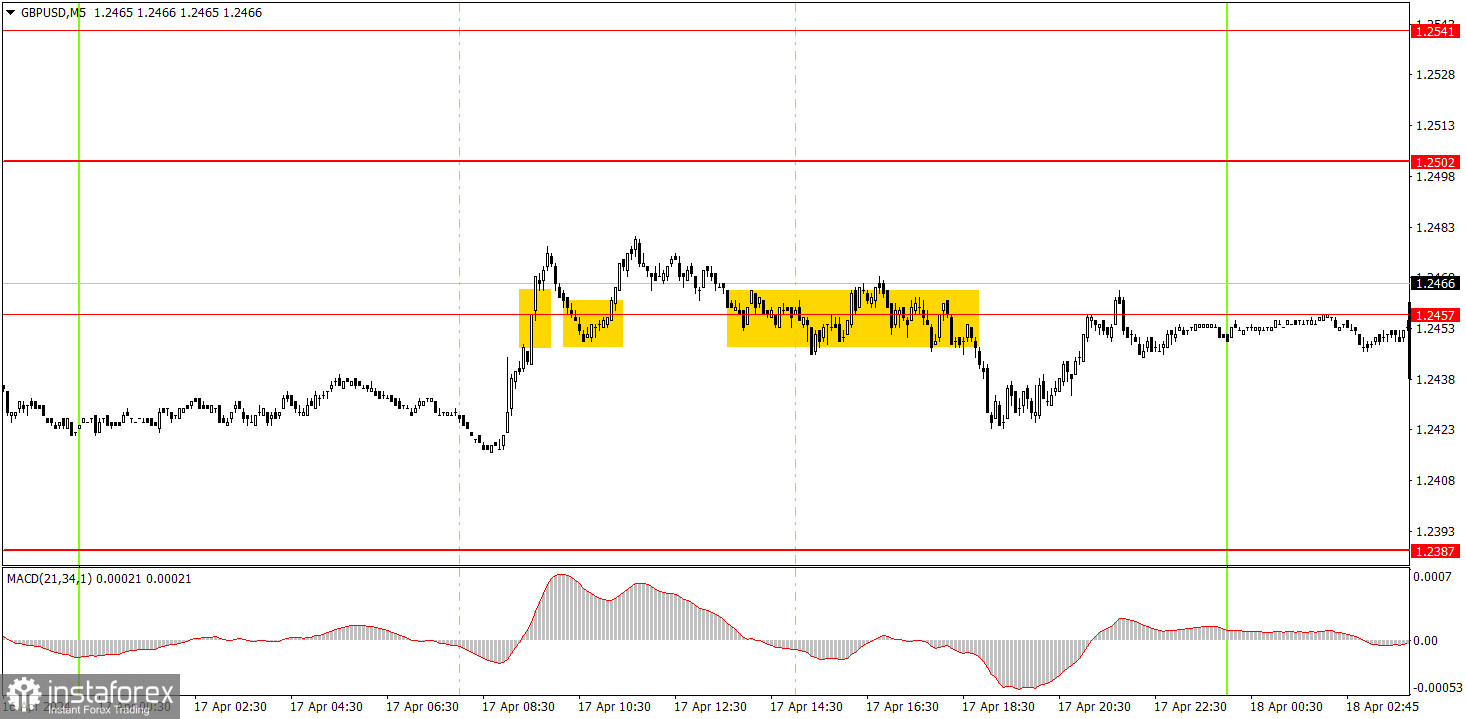
Several trading signals were formed on the 5-minute timeframe, but due to the flat movement over the past few days, all the signals turned out to be false. Initially, the pair breached the level of 1.2457 from below, then rebounded from it from above (a duplicate signal), and finally settled below it. Beginners could open both long and short positions yesterday, but at best, they faced breakeven outcomes. Traders could only potentially earn 10-15 pips with the second trade by manually closing it closer to the evening.
On the hourly chart, the GBP/USD pair has real technical grounds for forming a downward trend. After breaking below the level of 1.2502, traders may expect a significant decline from the pound. The fundamental and macroeconomic backdrop continues to support the dollar to a much greater extent than the British one. Therefore, we only expect downward movements from the pair. However, it seems that once again the market is not in a rush to sell the British pound...
On Thursday, novice traders can look for new sell signals below the level of 1.2502. Unfortunately, the pound is in a flat phase this week, so we shouldn't expect logical movements. This week's macroeconomic backdrop is weak, so we shouldn't expect strong movements either.
The key levels on the 5M chart are 1.2270, 1.2310, 1.2372-1.2387, 1.2457, 1.2502, 1.2544, 1.2605-1.2611, 1.2648, 1.2691, 1.2725, 1.2787-1.2791. No important events scheduled in the UK, while the US will only release secondary reports on unemployment claims and new home sales. We can expect another boring day.
1) Signal strength is determined by the time taken for its formation (either a bounce or level breach). A shorter formation time indicates a stronger signal.
2) If two or more trades around a certain level are initiated based on false signals, subsequent signals from that level should be disregarded.
3) In a flat market, any currency pair can produce multiple false signals or none at all. In any case, the flat trend is not the best condition for trading.
4) Trading activities are confined between the onset of the European session and mid-way through the U.S. session, after which all open trades should be manually closed.
5) On the 30-minute timeframe, trades based on MACD signals are only advisable amidst substantial volatility and an established trend, confirmed either by a trendline or trend channel.
6) If two levels lie closely together (ranging from 5 to 15 pips apart), they should be considered as a support or resistance zone.
Support and Resistance price levels can serve as targets when buying or selling. You can place Take Profit levels near them.
Red lines represent channels or trend lines, depicting the current market trend and indicating the preferable trading direction.
The MACD(14,22,3) indicator, encompassing both the histogram and signal line, acts as an auxiliary tool and can also be used as a signal source.
Significant speeches and reports (always noted in the news calendar) can profoundly influence the price dynamics. Hence, trading during their release calls for heightened caution. It may be reasonable to exit the market to prevent abrupt price reversals against the prevailing trend.
Beginners should always remember that not every trade will yield profit. Establishing a clear strategy coupled with sound money management is the cornerstone of sustained trading success.
InstaForex analytical reviews will make you fully aware of market trends! Being an InstaForex client, you are provided with a large number of free services for efficient trading.


