 Stay
Stay 
Trading Conditions
Products
Tools


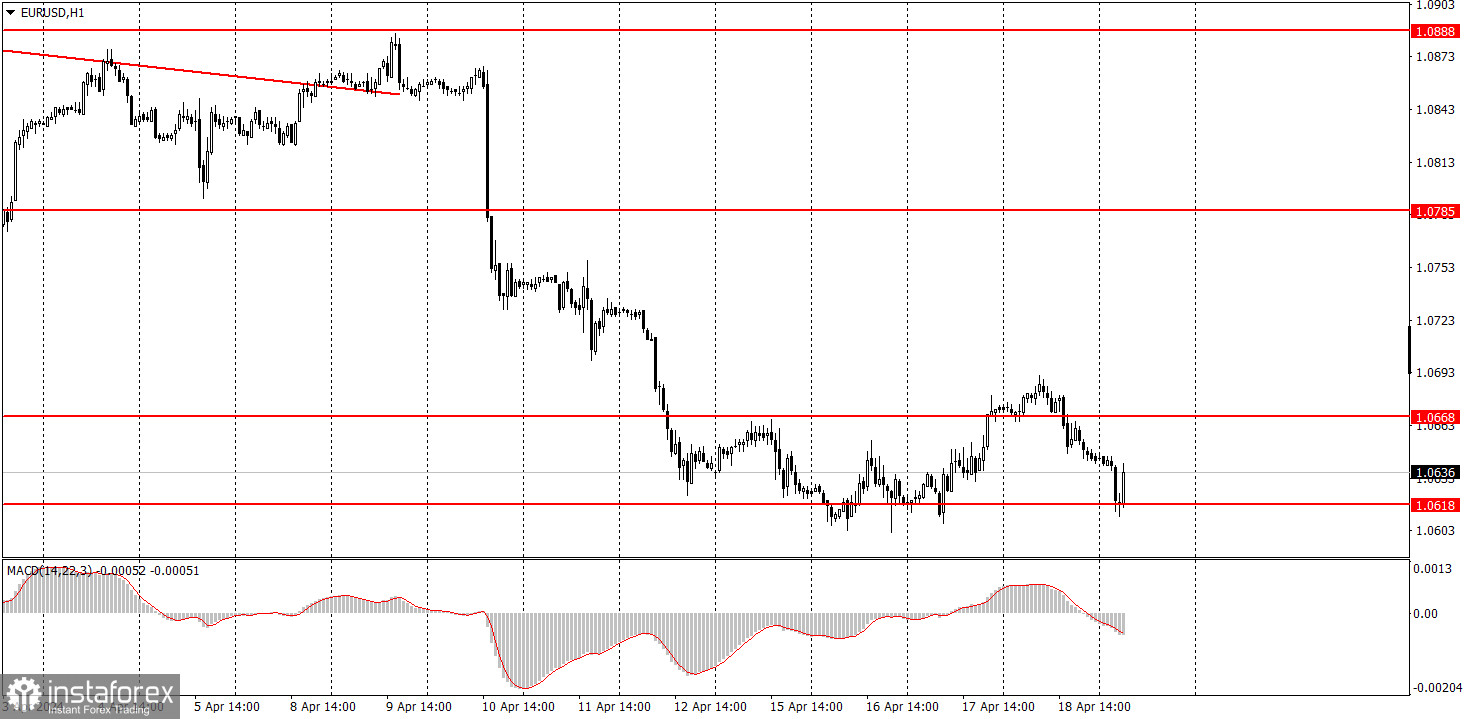
EUR/USD traded with low volatility on Thursday. The hourly time chart clearly shows that this week has been quite dull with low activity. Yesterday, the euro fell, but overall, we have been observing a flat market for almost five consecutive days. There was hardly any important information and macro data this week. For instance, yesterday, there were no significant reports. However, this week, Federal Reserve Chair Jerome Powell mentioned something important. Powell sees "lack of further progress" on inflation. This basically means that the Fed is backing away from plans to ease monetary policy in the near future. If inflation in the US stands at 3.5%, then we shouldn't expect the "right time" to arrive anytime soon. The US dollar may continue to rise in the coming weeks and months.
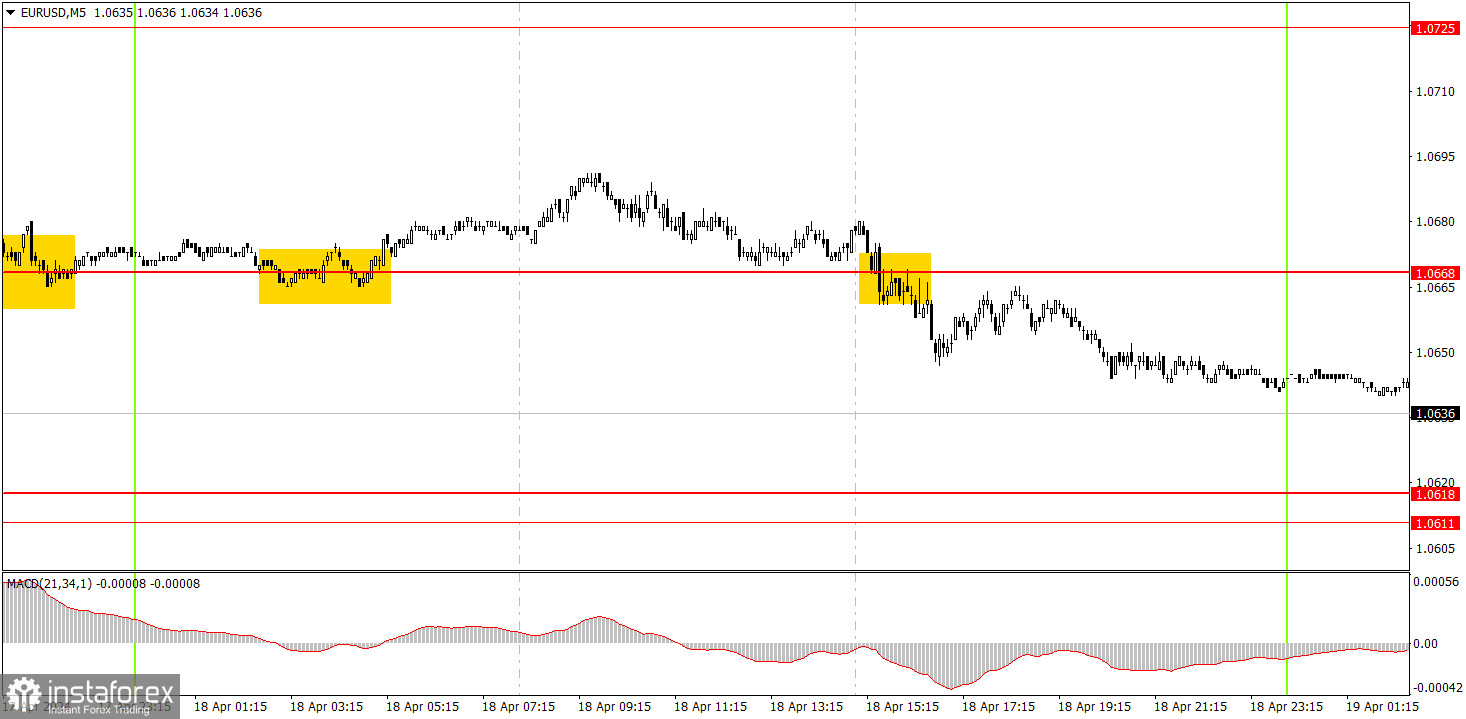
Two trading signals were generated on the 5-minute timeframe, but volatility remained weak, so it was not possible to gain significant profits. During the night, there was a rebound from the level of 1.0668. After that, the price went up by 13 pips. At the beginning of the US trading session, the price breached the level of 1.0668, after which it moved in the intended direction by about 10 pips. Thus, the first trade closed with a small loss, and the second one with a small profit. Once again, we will remind you that if the pair shows weak movements, it is not possible to make profit (especially when intraday trading) regardless of any trading signals.
On the hourly chart, the downtrend persists. We believe that the euro should fall further, as it is still too high, and in general, the trend is headed downwards. The recent macro data have shown the strength of the US economy and that it is unlikely for the Fed to lower rates in the near future. The pair has no reasons to rise.
On Friday, the euro may continue to correct higher. A new bounce from the area of 1.0611-1.0618 will provoke a new corrective phase with 1.0668 as the target. A breakthrough will help in bringing back the downtrend.
The key levels on the 5M chart are 1.0483, 1.0526, 1.0568, 1.0611-1.0618, 1.0668, 1.0725, 1.0785-1.0797, 1.0838-1.0856, 1.0888-1.0896, 1.0940, 1.0971-1.0981. There are no scheduled events in the European Union, and the US events calendar is also empty. Therefore, it is unlikely for the pair to break through the 1.0611-1.0618 area and we don't expect trends during the day.
1) Signal strength is determined by the time taken for its formation (either a bounce or level breach). A shorter formation time indicates a stronger signal.
2) If two or more trades around a certain level are initiated based on false signals, subsequent signals from that level should be disregarded.
3) In a flat market, any currency pair can produce multiple false signals or none at all. In any case, the flat trend is not the best condition for trading.
4) Trading activities are confined between the onset of the European session and mid-way through the U.S. session, after which all open trades should be manually closed.
5) On the 30-minute timeframe, trades based on MACD signals are only advisable amidst substantial volatility and an established trend, confirmed either by a trendline or trend channel.
6) If two levels lie closely together (ranging from 5 to 15 pips apart), they should be considered as a support or resistance zone.
Support and Resistance price levels can serve as targets when buying or selling. You can place Take Profit levels near them.
Red lines represent channels or trend lines, depicting the current market trend and indicating the preferable trading direction.
The MACD(14,22,3) indicator, encompassing both the histogram and signal line, acts as an auxiliary tool and can also be used as a signal source.
Significant speeches and reports (always noted in the news calendar) can profoundly influence the price dynamics. Hence, trading during their release calls for heightened caution. It may be reasonable to exit the market to prevent abrupt price reversals against the prevailing trend.
Beginning traders should always remember that not every trade will yield profit. Establishing a clear strategy coupled with sound money management is the cornerstone of sustained trading success.
InstaForex analytical reviews will make you fully aware of market trends! Being an InstaForex client, you are provided with a large number of free services for efficient trading.


