 Stay
Stay 
Trading Conditions
Products
Tools


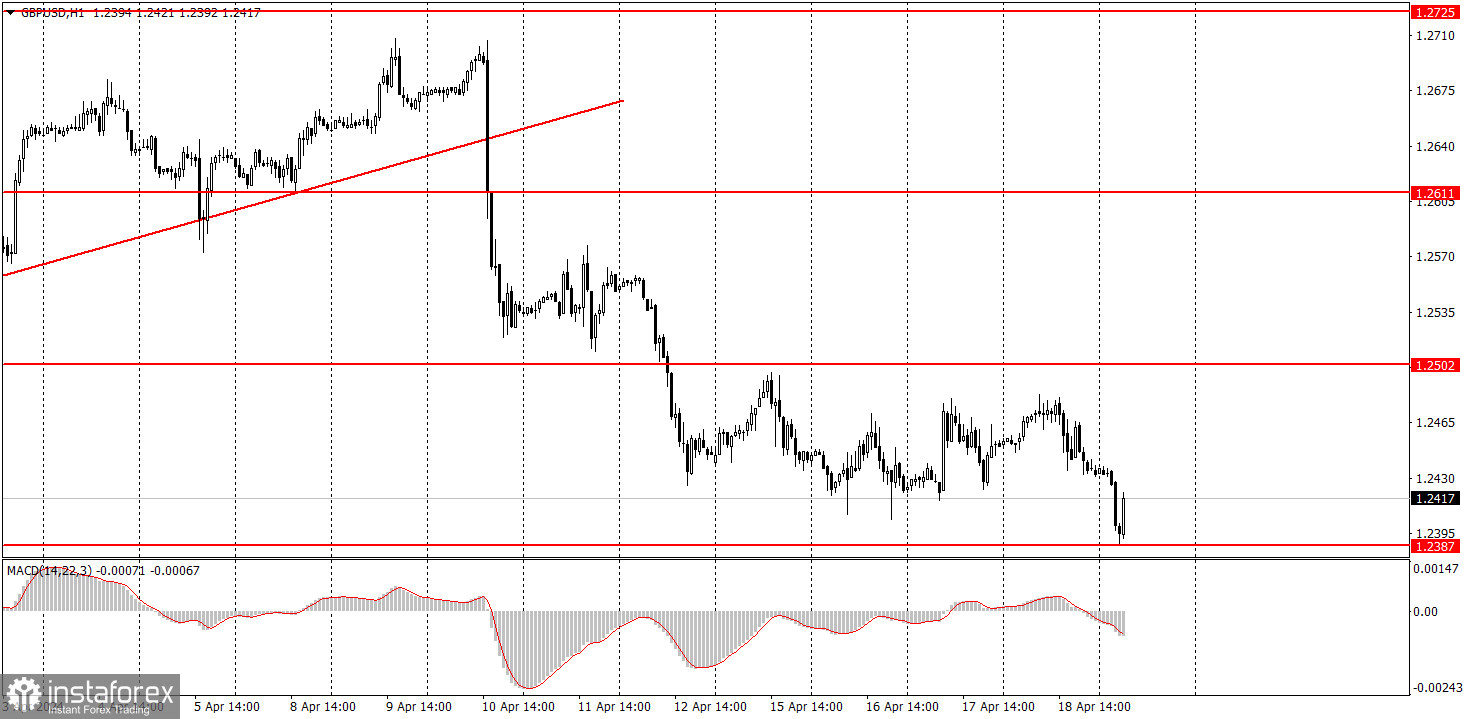
The GBP/USD pair also started a new downward movement on Thursday, which continued overnight. There was no significant macro data in the US or the UK, so we can't say that the pair fell due to news or reports. Earlier this week, the market easily ignored Federal Reserve Chair Jerome Powell's speech. Overall, the downward trend persists, but this week the price has been moving more sideways than up or down. We have not seen a significant correction, nor has the downtrend resumed. However, the fact that the pound is still gradually moving downward is encouraging. It gives reason to believe that we will still see a downtrend towards the 1.20 level, which the British currency has long deserved. Today, a bounce from the level of 1.2387 may trigger a new phase of minor growth.
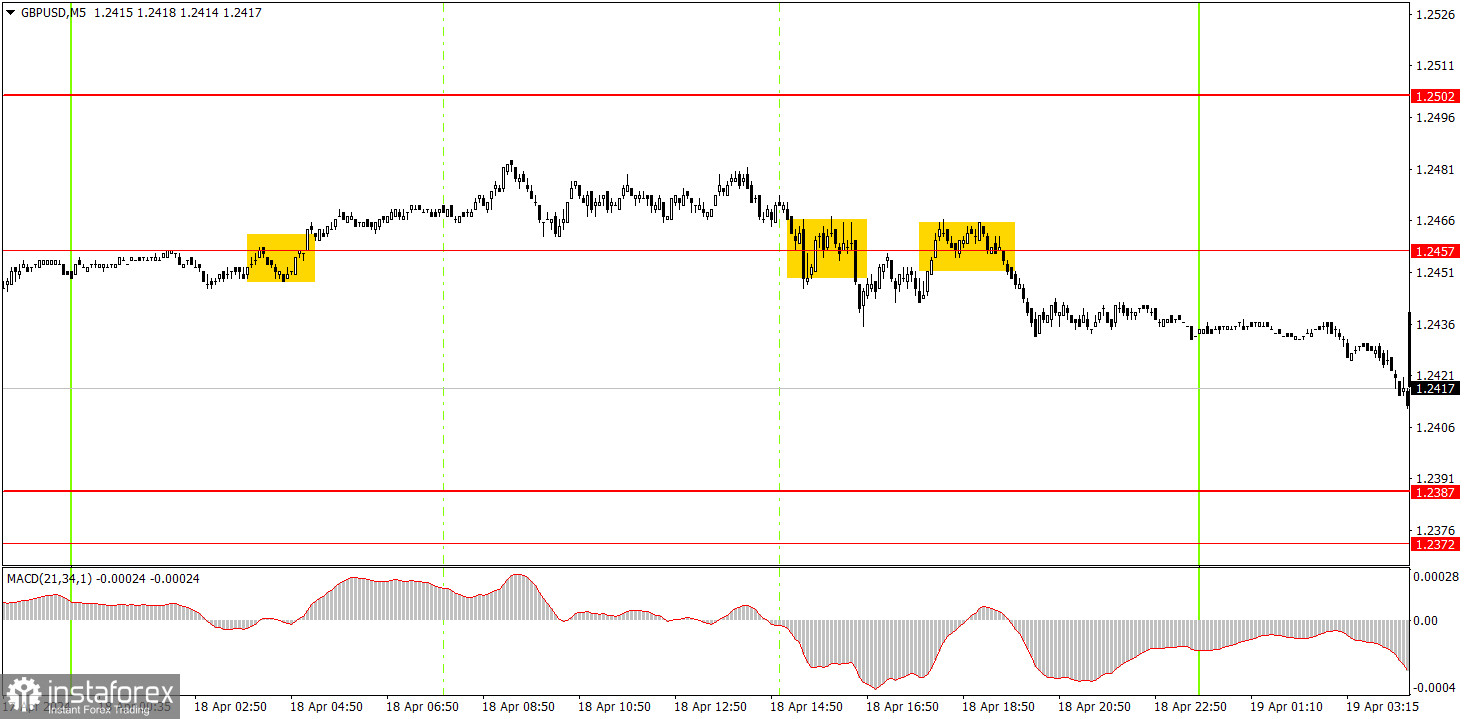
Three trading signals were formed on the 5-minute timeframe, but all of them were substandard. If the pair is in a flat phase, then any levels are merely for formality. Especially those that are within a sideways channel. Therefore, neither the consolidation above the level of 1.2457 nor the consolidation below this mark triggered a good movement yesterday. In all three cases, the price failed to move in the intended direction by 20 pips, which would have been enough to set the Stop Loss to breakeven. The total volatility of the day was 52 pips...
On the hourly chart, the GBP/USD pair has real technical grounds for forming a downward trend. After breaking below the level of 1.2502, traders may expect a significant decline from the pound. The fundamental and macroeconomic backdrop continues to support the dollar much more than the British pound. Therefore, we only expect downward movement from the pair. However, it seems that the market is not in a rush to sell the British currency.
On Friday, novice traders can look for new sell signals below the level of 1.2502. Unfortunately, the pound has been flat this week, so we shouldn't expect logical movements. This week's macroeconomic backdrop is weak, so we shouldn't expect strong movements either. The bounce from the level of 1.2387 could have been used for long positions, but it happened overnight.
The key levels on the 5M chart are 1.2270, 1.2310, 1.2372-1.2387, 1.2457, 1.2502, 1.2544, 1.2605-1.2611, 1.2648, 1.2691, 1.2725, 1.2787-1.2791. The UK retail sales report is due on Friday, while the US economic calendar is basically empty. Therefore, we expect another flat phase. It's unlikely that the price will break below the level of 1.2387.
1) Signal strength is determined by the time taken for its formation (either a bounce or level breach). A shorter formation time indicates a stronger signal.
2) If two or more trades around a certain level are initiated based on false signals, subsequent signals from that level should be disregarded.
3) In a flat market, any currency pair can produce multiple false signals or none at all. In any case, the flat trend is not the best condition for trading.
4) Trading activities are confined between the onset of the European session and mid-way through the U.S. session, after which all open trades should be manually closed.
5) On the 30-minute timeframe, trades based on MACD signals are only advisable amidst substantial volatility and an established trend, confirmed either by a trendline or trend channel.
6) If two levels lie closely together (ranging from 5 to 15 pips apart), they should be considered as a support or resistance zone.
Support and Resistance price levels can serve as targets when buying or selling. You can place Take Profit levels near them.
Red lines represent channels or trend lines, depicting the current market trend and indicating the preferable trading direction.
The MACD(14,22,3) indicator, encompassing both the histogram and signal line, acts as an auxiliary tool and can also be used as a signal source.
Significant speeches and reports (always noted in the news calendar) can profoundly influence the price dynamics. Hence, trading during their release calls for heightened caution. It may be reasonable to exit the market to prevent abrupt price reversals against the prevailing trend.
Beginners should always remember that not every trade will yield profit. Establishing a clear strategy coupled with sound money management is the cornerstone of sustained trading success.
InstaForex analytical reviews will make you fully aware of market trends! Being an InstaForex client, you are provided with a large number of free services for efficient trading.


