 Stay
Stay 
Trading Conditions
Products
Tools


GBP/USD
Analysis:
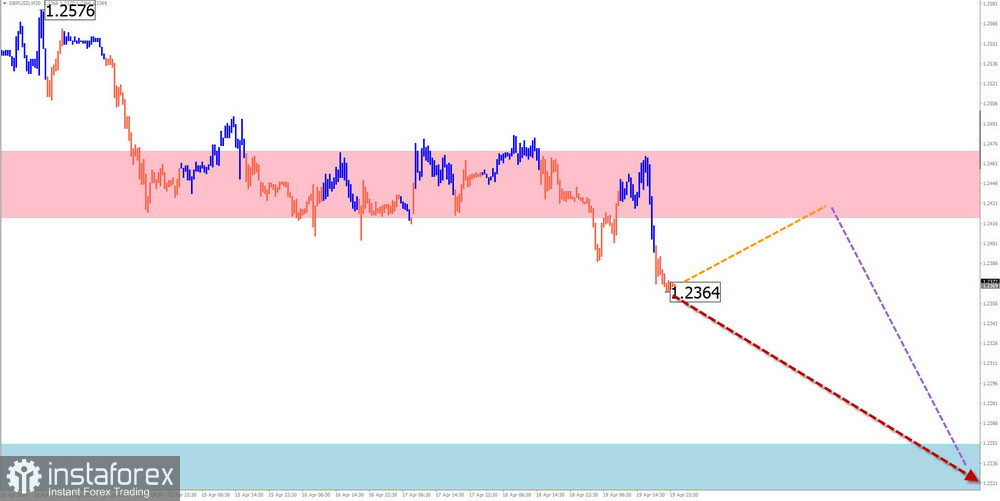
The daily chart scale of the major pair of the British pound since last summer demonstrates the formation of a horizontal descending correction. By now, quotes have reached the boundaries of a strong potential reversal zone. The wave structure has developed a stretched flat correction since the beginning of March. Last week, the price of the major broke through strong resistance, turning it into support.
Forecast:
Pressure on the resistance zone is expected in the next couple of days. Then, a reversal and a resumption of the bearish trend can be anticipated. When the direction changes, a brief breakthrough of the upper resistance boundary is possible. The calculated support represents the lower limit of the expected weekly movement of the pair.
Potential Reversal Zones
Resistance:
Support:
Recommendations:
Buying: There won't be conditions for such deals in the upcoming week.
Selling: Will become relevant after the appearance of confirmed reversal signals around the resistance zone.
AUD/USD
Analysis:
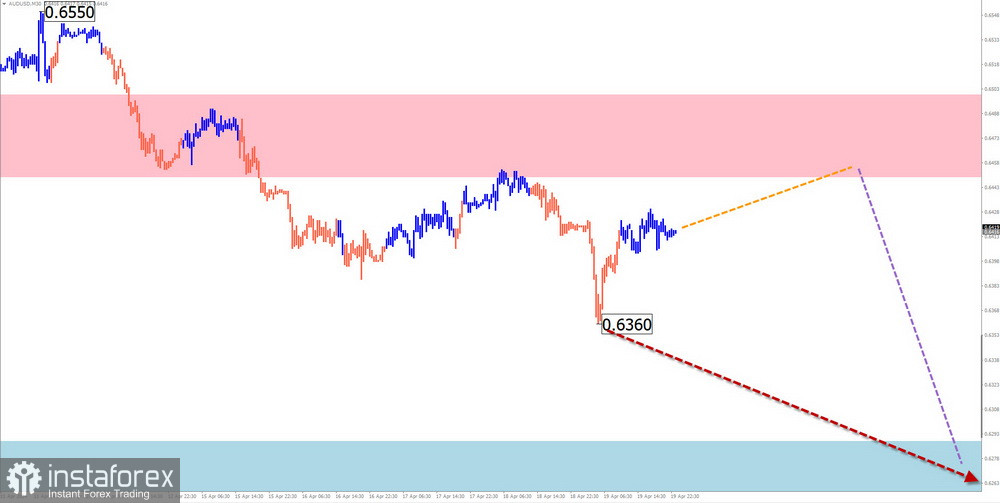
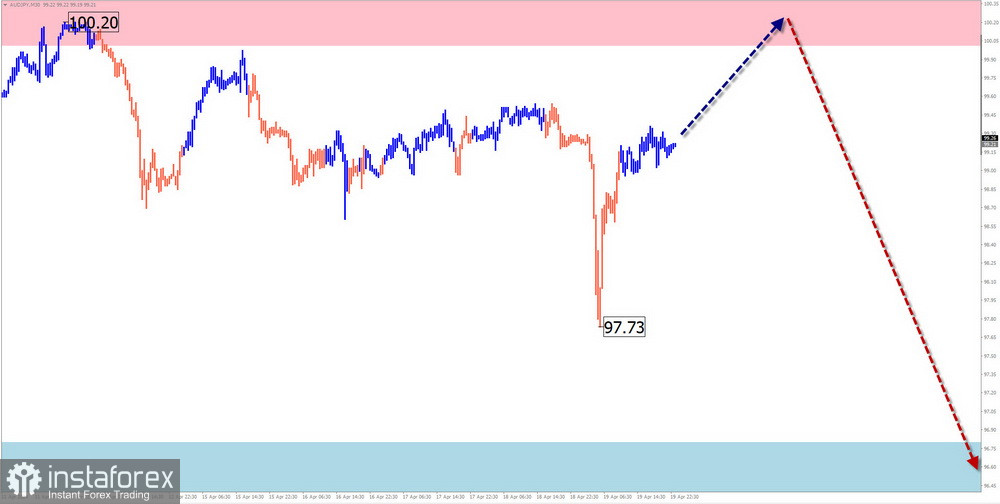
The price fluctuations of the main pair of the Australian dollar have been determined by a descending wave algorithm since December last year. Since April, quotes have been forming the final part of the wave (C). Last week, the price broke through strong support, but it has become resistance. An intermediate pullback has been developing on the chart since last week.
Forecast:
In the upcoming week, gradual movement of the Aussie quotes from the calculated resistance zone towards support is expected. A breakthrough beyond the indicated boundaries within the upcoming week is unlikely. Pressure on the resistance zone is possible in the first few days.
Potential Reversal Zones
Resistance:
Support:
Recommendations:
Buying: Possible with fractional volumes within individual sessions. Resistance boundaries limit the potential.
Selling: This can be used in trading transactions after confirmed reversal signals appear around the calculated resistance zone.
USD/CHF
Analysis:
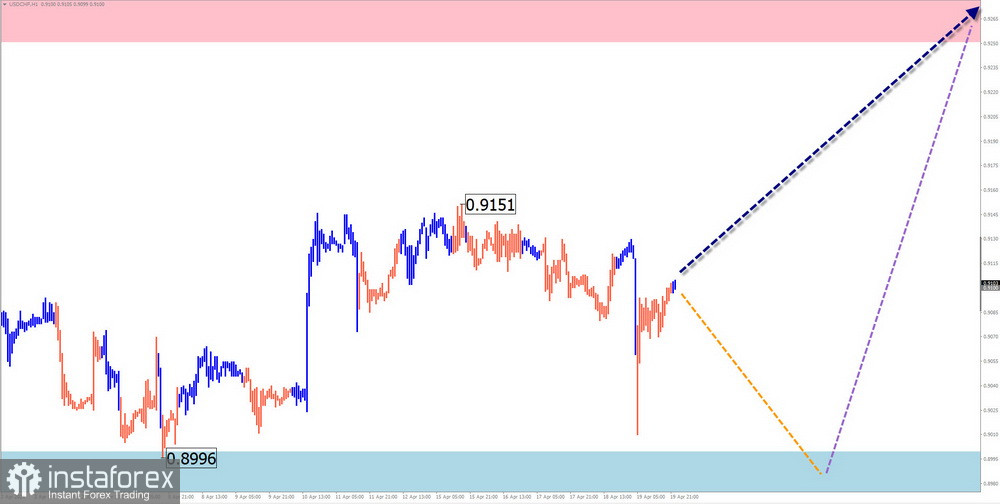
From a short-term perspective, the current wave of the Swiss franc since the end of December last year has been upwards. The wave completes a larger bearish structure of the weekly timeframe. The wave structure has entered its final phase. The lower boundary of a powerful potential reversal zone of the weekly timeframe passes near the calculated resistance.
Forecast:
Continuation of the overall bullish trend of the franc's price movement is expected in the upcoming week. A brief decline towards the support area is not excluded in the next couple of days. A breakout of its lower boundary is unlikely. The highest volatility is expected towards the end of the week.
Potential Reversal Zones
Resistance:
Support:
Recommendations:
Buying: Carry a high degree of risk and may incur losses.
Selling: This will become relevant for trading transactions after corresponding confirmed signals appear around the resistance zone.
EUR/JPY
Analysis:
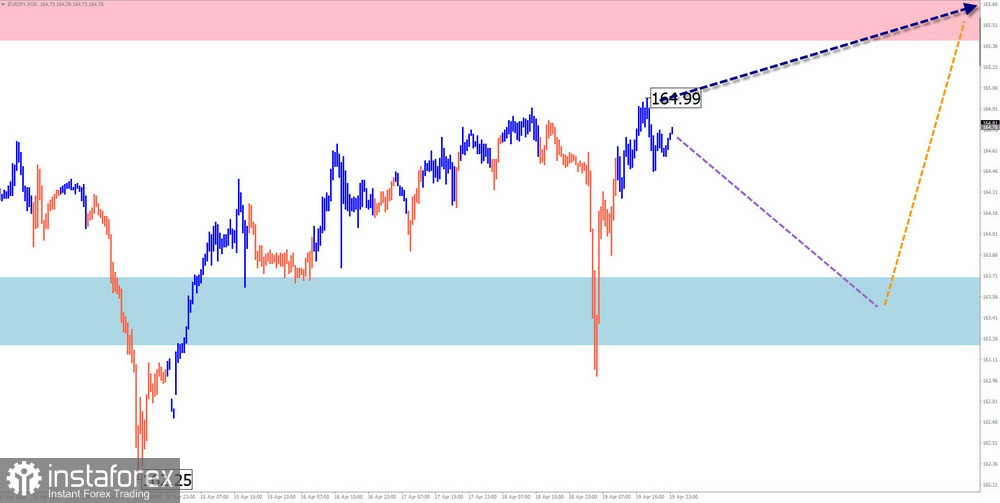
An ascending trend dominates on a large-scale chart of the euro/Japanese yen pair. The unfinished segment of the main course started on April 12th. Recently, the price has been forming a correction before a powerful upward breakthrough. At the end of last week, an ascending segment with reversal potential began to form on the chart.
Forecast:
A flat mood of price fluctuations can be expected in the next couple of days. A downward vector is probable, with a decrease in price no further than the calculated support boundaries. In the second half of the week, the probability of increased volatility, reversal, and resumption of active price growth increases.
Potential Reversal Zones
Resistance:
Support:
Recommendations:
Selling: These are risky and may incur losses.
Buying: These can be used in trading after corresponding signals around the support zone appear.
AUD/JPY
Analysis:
For the past four years, the direction of movement of the Australian dollar/Japanese yen pair has been set by a bullish trend. The last unfinished segment of movement is currently downward. Its structure resembles a shifting plane. At the time of the analysis, quotes are at the lower edge of the powerful resistance zone of the weekly timeframe. There are no signs of an imminent reversal on the chart.
Forecast:
At the beginning of the upcoming week, renewed pressure on the resistance zone is highly likely. A brief breakout of the upper boundary is not excluded. In the second half, the probability of a reversal and the beginning of a downward movement of the pair increases.
Potential Reversal Zones
Resistance:
Support:
Recommendations:
Buying: Have low potential and are highly risky.
Selling: This will become relevant after confirming that signals around the resistance zone appear.
US dollar index
Brief Analysis:
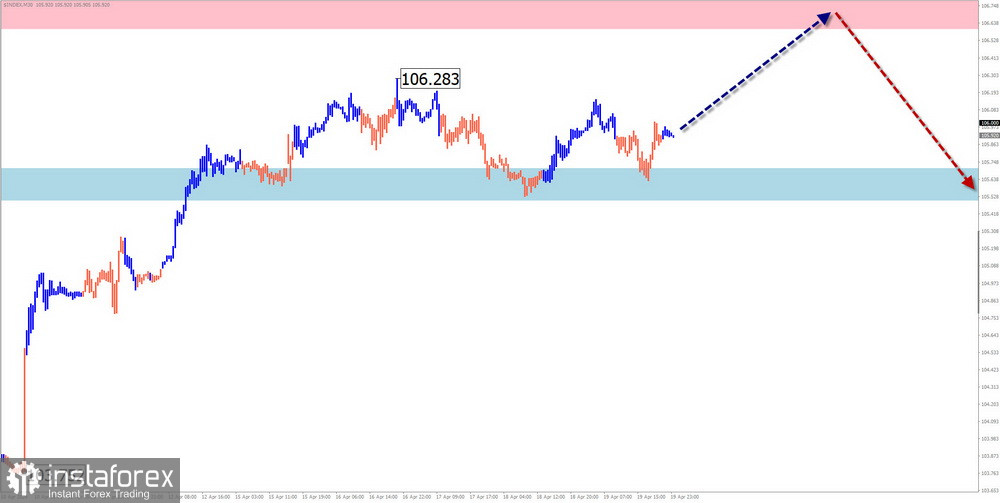
An ascending wave algorithm sets the direction of movements of the North American dollar index since the end of December last year. The structure is forming the final part (C). It appears to be completed, but there are no signals of a change in course on the chart. Last week, after contacting the lower boundary of strong resistance, quotes drifted sideways, forming an intermediate pullback.
Weekly Forecast:
An increase in the US dollar exchange rate can be expected in the next couple of days. A transition to sideways drift, and the formation of a reversal are highly likely to be around the calculated resistance. The beginning of a decline in the index can be expected towards the end of the week.
Potential Reversal Zones
Resistance:
Support:
Recommendations:
The period of strengthening the dollar and selling national currencies in majors is nearing its end. Buying national currencies in major pairs may become the main direction for trading after the appearance of corresponding reversal signals around the resistance zone.
Notes: In simplified wave analysis (SWA), all waves consist of 3 parts (A-B-C). The last unfinished wave is analyzed on each timeframe. Dotted lines indicate expected movements.
Attention: The wave algorithm does not consider the duration of instrument movements in time!
InstaForex analytical reviews will make you fully aware of market trends! Being an InstaForex client, you are provided with a large number of free services for efficient trading.


