 Stay
Stay 
Trading Conditions
Products
Tools


EUR/USD traded with low volatility on Friday. The hourly chart shows that the previous week was quite dull with low activity. The price mostly moved sideways, and the macroeconomic background was weak. Although there were several fundamental events that could have potentially triggered a new rise in the dollar and a fall in the euro, the market was not interested in opening more short positions at this stage. Therefore, the speeches by representatives of the Federal Reserve and the European Central Bank were mostly ignored. However, this might have been a mistake. For instance, Fed Chair Jerome Powell made it clear that the central bank does not intend to lower the key interest rate in June, as the market had expected. Powell said persistently elevated inflation will likely delay any Fed rate cut. Several of his colleagues shared the same sentiments. Therefore, the Fed will continue to show a hawkish stance. There is also a possibility that the Fed may eventually consider a rate hike this year.
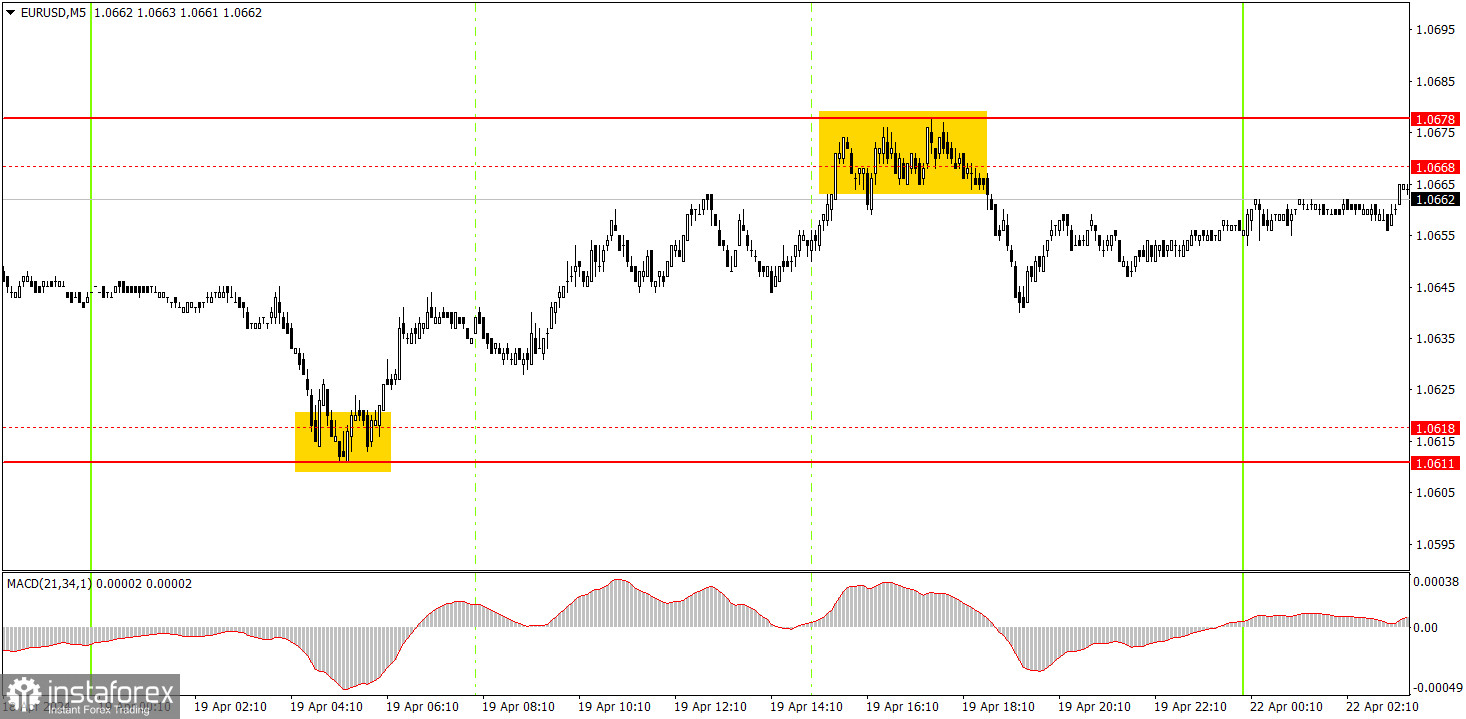
Two fairly good trading signals were generated on the 5-minute timeframe. During the Asian session, the price rebounded perfectly from the area of 1.0611-1.0618, after which it managed to rise to the level of 1.0668, which was later refined to 1.0678 by the end of the day. Therefore, novice traders could open long positions in the morning and close them at the beginning of the US session. Short positions could be opened around the level of 1.0668 based on the signal, but the pair did not sharply fall until the market closed. Therefore, this would have been a small profit. Overall, both trades were profitable, but due to the low volatility, the profit was not substantial.
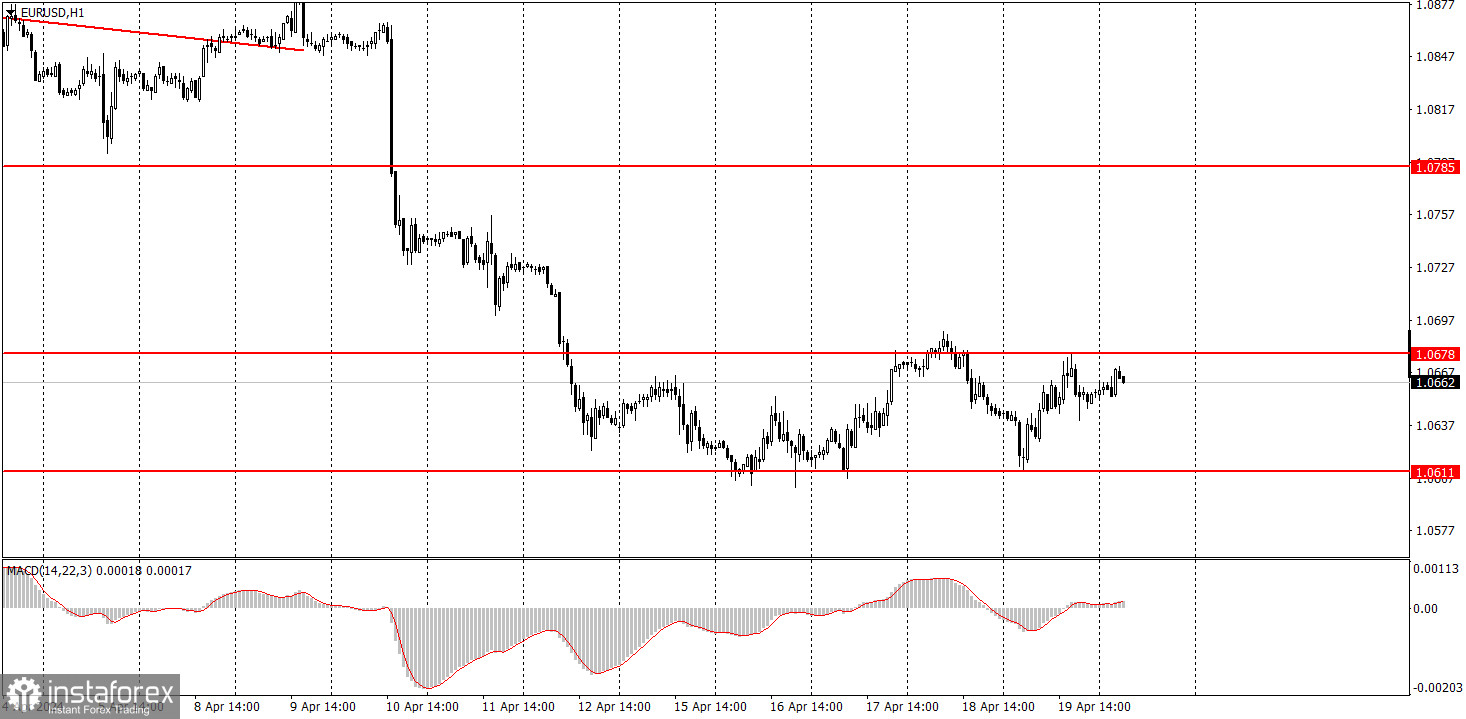
On the hourly chart, the downtrend persists. We believe that the euro should fall further, as it is still too high, and in general, the trend is headed downwards. The recent macro data have demonstrated the strength of the US economy and that it is unlikely for the Fed to lower rates in the near future. The euro can only count on corrective growth.
Today, the euro may continue to trade within the sideways channel of 1.0611-1.0678. If the price breaks out of this range, it may form a short-term trend for the coming days, which traders can use.
The key levels on the 5M chart are 1.0483, 1.0526, 1.0568, 1.0611, 1.0678, 1.0725, 1.0785-1.0797, 1.0838-1.0856, 1.0888-1.0896, 1.0940, 1.0971-1.0981. On Monday, we can highlight European Central Bank President Christine Lagarde's speech. We do not expect any important statements from her, but the market may show a minor reaction.
1) Signal strength is determined by the time taken for its formation (either a bounce or level breach). A shorter formation time indicates a stronger signal.
2) If two or more trades around a certain level are initiated based on false signals, subsequent signals from that level should be disregarded.
3) In a flat market, any currency pair can produce multiple false signals or none at all. In any case, the flat trend is not the best condition for trading.
4) Trading activities are confined between the onset of the European session and mid-way through the U.S. session, after which all open trades should be manually closed.
5) On the 30-minute timeframe, trades based on MACD signals are only advisable amidst substantial volatility and an established trend, confirmed either by a trendline or trend channel.
6) If two levels lie closely together (ranging from 5 to 15 pips apart), they should be considered as a support or resistance zone.
Support and Resistance price levels can serve as targets when buying or selling. You can place Take Profit levels near them.
Red lines represent channels or trend lines, depicting the current market trend and indicating the preferable trading direction.
The MACD(14,22,3) indicator, encompassing both the histogram and signal line, acts as an auxiliary tool and can also be used as a signal source.
Significant speeches and reports (always noted in the news calendar) can profoundly influence the price dynamics. Hence, trading during their release calls for heightened caution. It may be reasonable to exit the market to prevent abrupt price reversals against the prevailing trend.
Beginning traders should always remember that not every trade will yield profit. Establishing a clear strategy coupled with sound money management is the cornerstone of sustained trading success.
InstaForex analytical reviews will make you fully aware of market trends! Being an InstaForex client, you are provided with a large number of free services for efficient trading.


