 Stay
Stay 
Trading Conditions
Products
Tools


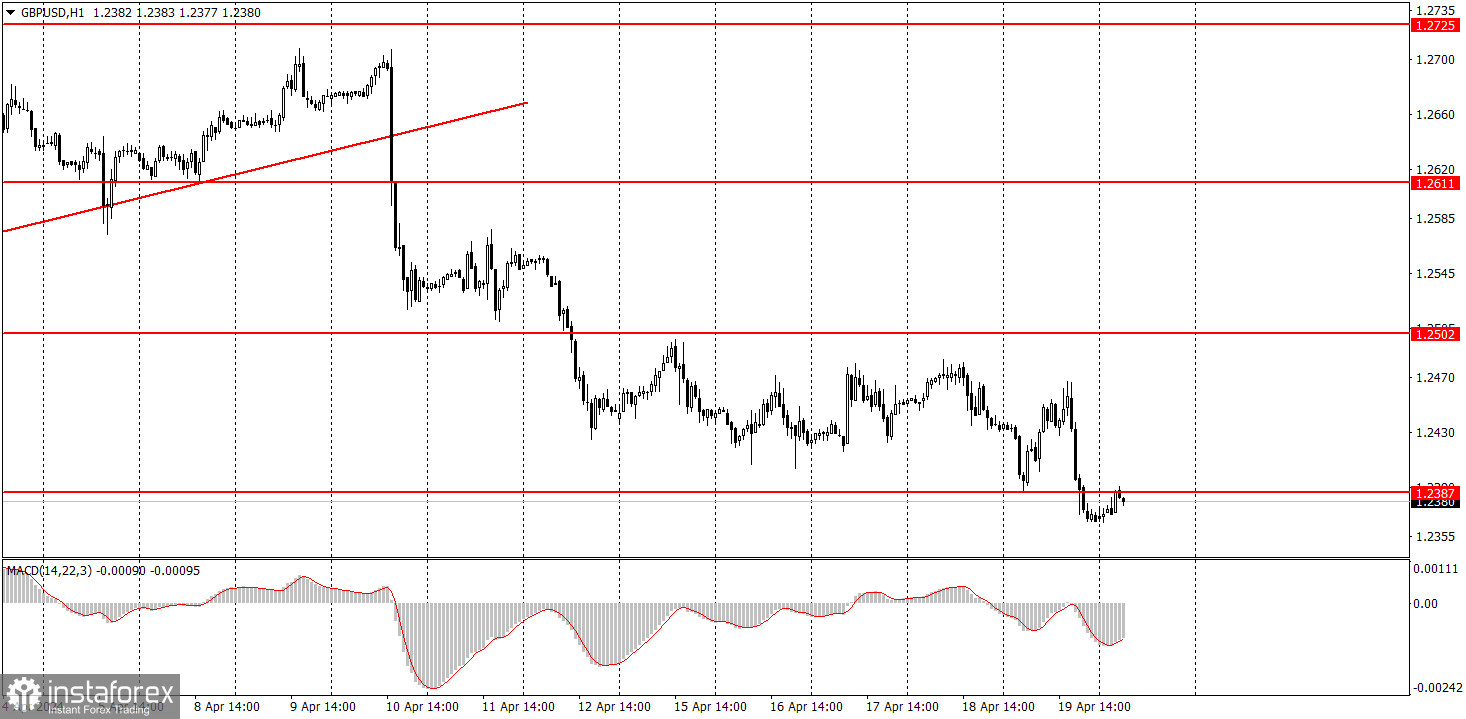
The GBP/USD pair surprisingly showed a downward movement on Friday. Although there weren't many surprises, as the UK retail sales report turned out weaker than expected, and in general, the pound should be falling at this time even without the help of macro data. Initially, the price bounced off the level of 1.2387, so it might have seemed that the flat would persist. However, in the last 6-7 hours of the working week, the pair formed a new downward movement and broke through this level. Therefore, the British pound may continue to fall further.
The only report of the day did not support the British pound. But overall, the UK has been showing weak economic reports for a long time now, while those for the US have been quite strong. In addition, the Bank of England may start to ease monetary policy even before the Federal Reserve, as inflation is rising in the US while it is falling in the UK. Therefore, we believe that the pound should continue to fall under any circumstances.
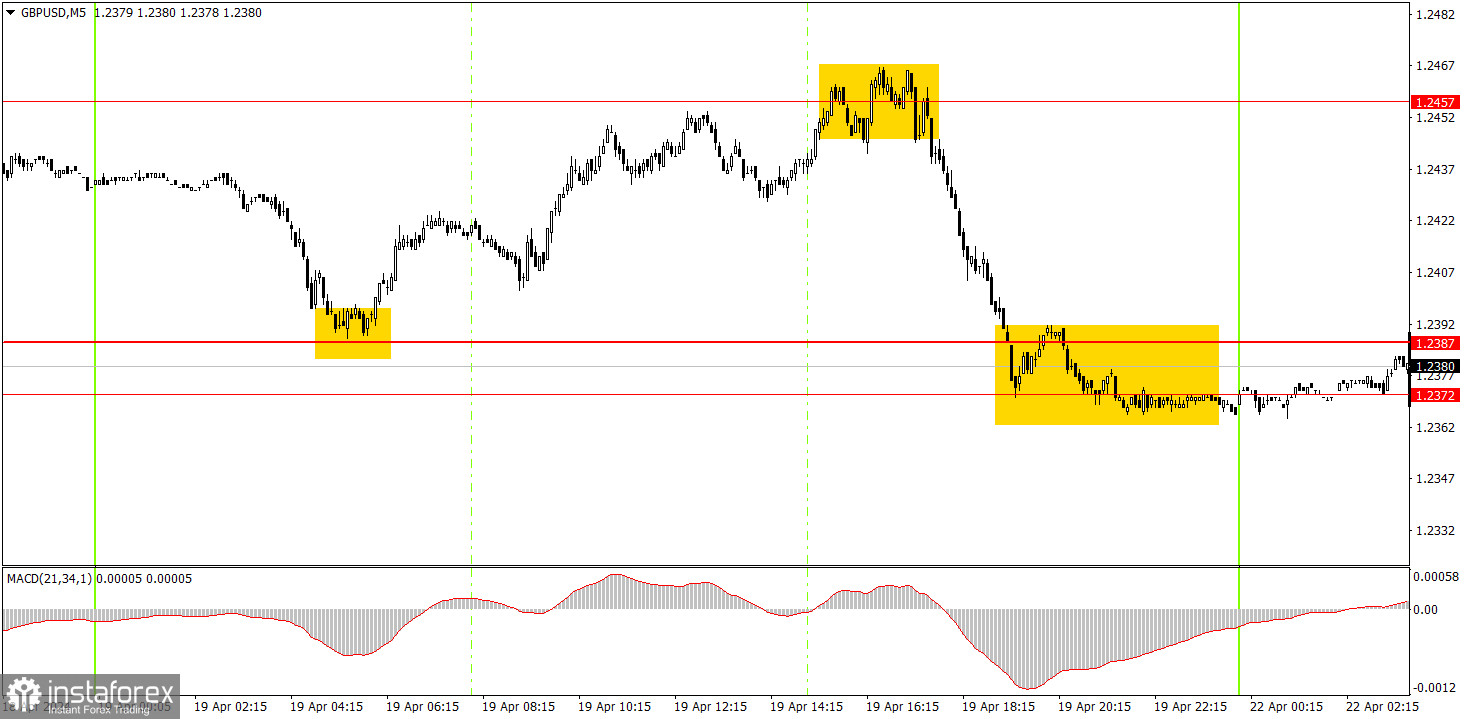
Several trading signals were formed on the 5-minute timeframe. Overnight, the price bounced off the level of 1.2387, but by the opening of the European session, it managed to show a sharp rise. Therefore, novice traders might have missed this signal. However, during the US session, there was a rebound from the level of 1.2457, after which the price dropped to the range of 1.2372-1.2387. Traders could have earned around 60 pips if they executed this signal.
On the hourly chart, the GBP/USD pair has excellent prospects for forming a downward trend. After breaking below the level of 1.2502, traders may expect a significant decline from the pound. The fundamental and macroeconomic backdrop continues to support the dollar much more than the British pound. Therefore, we only expect downward movements from the pair.
Today, novice traders can look for new sell signals below the range of 1.2372-1.2387. The market is not in a rush to sell the pair, but the pound is gradually depreciating over time, which is a good sign. There will be few significant events this week, so we expect low volatility, and we may not see intraday trend movements every day.
The key levels on the 5M chart are 1.2270, 1.2310, 1.2372-1.2387, 1.2457, 1.2502, 1.2544, 1.2605-1.2611, 1.2648, 1.2691, 1.2725, 1.2787-1.2791. There are no important or secondary events planned in the UK and the US. Most likely, we are in for another "boring Monday".
1) Signal strength is determined by the time taken for its formation (either a bounce or level breach). A shorter formation time indicates a stronger signal.
2) If two or more trades around a certain level are initiated based on false signals, subsequent signals from that level should be disregarded.
3) In a flat market, any currency pair can produce multiple false signals or none at all. In any case, the flat trend is not the best condition for trading.
4) Trading activities are confined between the onset of the European session and mid-way through the U.S. session, after which all open trades should be manually closed.
5) On the 30-minute timeframe, trades based on MACD signals are only advisable amidst substantial volatility and an established trend, confirmed either by a trendline or trend channel.
6) If two levels lie closely together (ranging from 5 to 15 pips apart), they should be considered as a support or resistance zone.
Support and Resistance price levels can serve as targets when buying or selling. You can place Take Profit levels near them.
Red lines represent channels or trend lines, depicting the current market trend and indicating the preferable trading direction.
The MACD(14,22,3) indicator, encompassing both the histogram and signal line, acts as an auxiliary tool and can also be used as a signal source.
Significant speeches and reports (always noted in the news calendar) can profoundly influence the price dynamics. Hence, trading during their release calls for heightened caution. It may be reasonable to exit the market to prevent abrupt price reversals against the prevailing trend.
Beginners should always remember that not every trade will yield profit. Establishing a clear strategy coupled with sound money management is the cornerstone of sustained trading success.
InstaForex analytical reviews will make you fully aware of market trends! Being an InstaForex client, you are provided with a large number of free services for efficient trading.


