 Stay
Stay 
Trading Conditions
Products
Tools


The GBP/USD pair also showed quite a strong upward movement on Tuesday, which was solely triggered by the macro data. Take note that the British pound doesn't have many reasons to rise, and the economic reports mostly work in favor of the dollar. However, yesterday the situation was the opposite. The US released disappointing PMI data, while British data were, so to speak, at a decent level. Therefore, the pound initially rose at the beginning of the European trading session, and then the dollar fell at the beginning of the US session. In total, GBP/USD increased by almost 100 pips.
However, we don't expect the pair to sustain the sharp upward movement. Unless, other US reports turn out to be just like yesterday's. But there are other, more global factors that support the US currency in the long term.
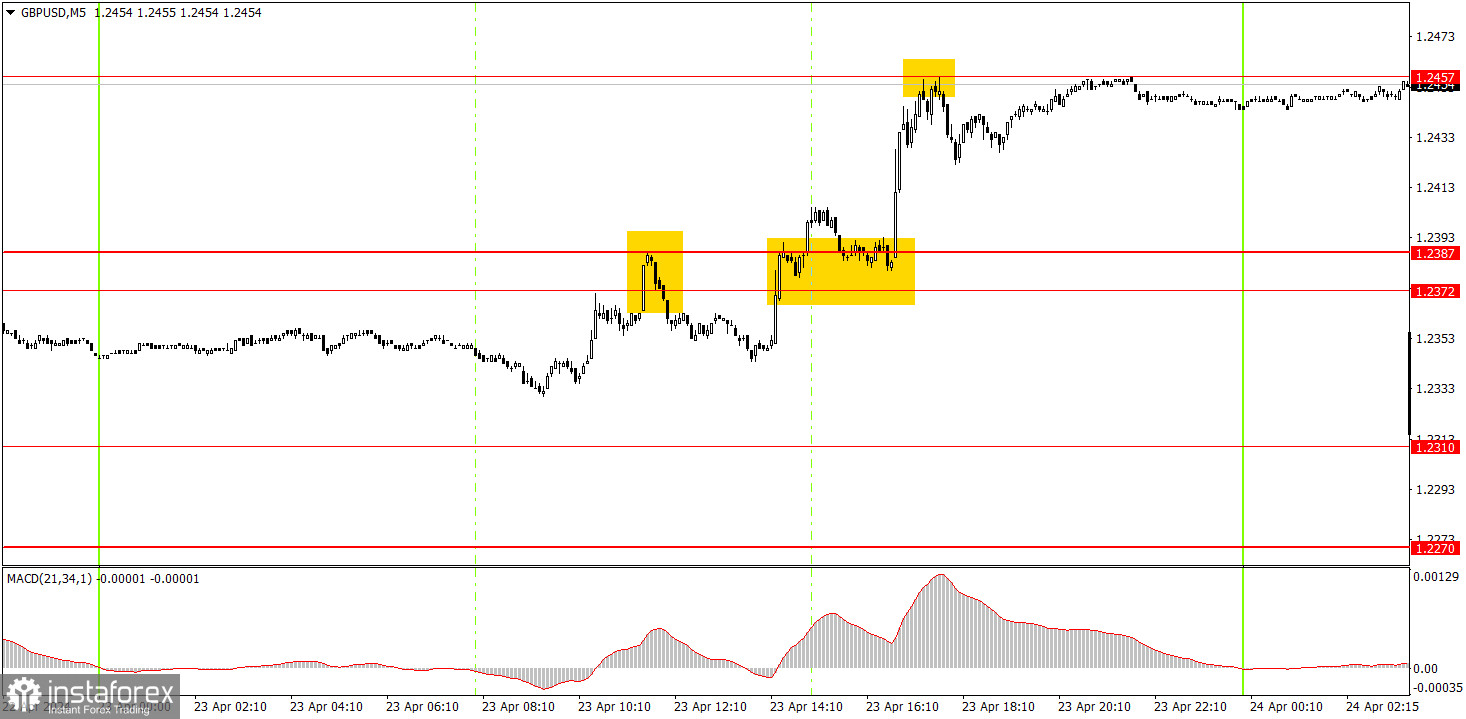
Three trading signals were formed on the 5-minute timeframe. Initially, the pair rebounded from the 1.2172-1.2387 range after it rose due to the UK PMIs. The decline was short-lived, and at the beginning of the US session, thanks to weak US data, the pair surpassed the 1.2172-1.2387 range. Subsequently, the price reached the nearest target at the level of 1.2457. Thus, novice traders could have opened two trades, the first of which closed at breakeven, and the second resulted in a profit of about 45 pips.
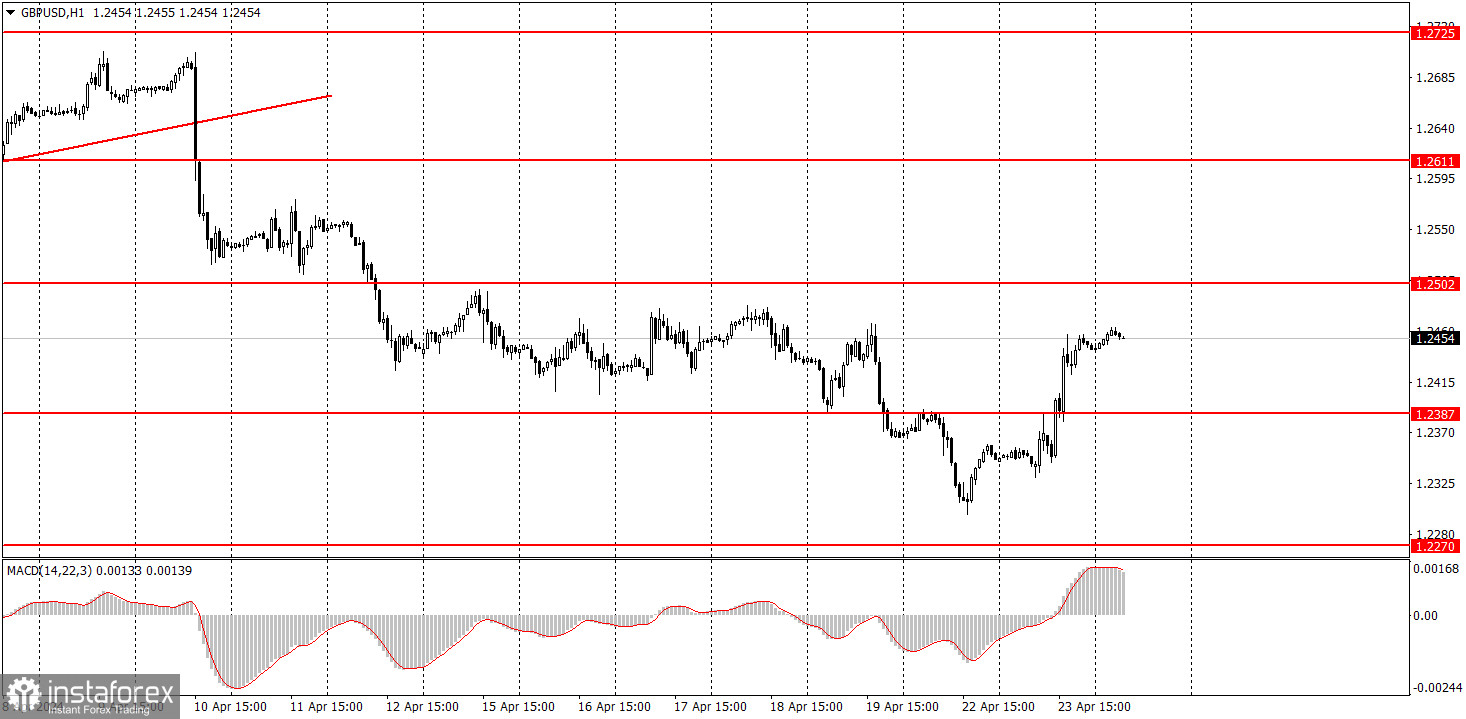
On the hourly chart, the GBP/USD pair has excellent prospects for forming a downward trend, but is currently going through a correction. After surpassing the level of 1.2502, traders may expect a significant decline from the pound. The fundamental and macroeconomic backdrop continues to support the dollar much more than the British pound. Therefore, we only expect downward movement from the pair.
Today, novice traders can look for new sell signals around the level of 1.2457. The market is not in a rush to sell the pair, but the pound is gradually depreciating over time, which is a good sign. Today, the US report on durable goods orders could exert pressure on the dollar. But if the report shows good values, then the dollar should recover yesterday's losses.
The key levels on the 5M chart are 1.2270, 1.2310, 1.2372-1.2387, 1.2457, 1.2502, 1.2544, 1.2605-1.2611, 1.2648, 1.2691, 1.2725, 1.2787-1.2791. No significant events scheduled in the UK. Today, traders will focus on the US report on durable goods orders.
1) Signal strength is determined by the time taken for its formation (either a bounce or level breach). A shorter formation time indicates a stronger signal.
2) If two or more trades around a certain level are initiated based on false signals, subsequent signals from that level should be disregarded.
3) In a flat market, any currency pair can produce multiple false signals or none at all. In any case, the flat trend is not the best condition for trading.
4) Trading activities are confined between the onset of the European session and mid-way through the U.S. session, after which all open trades should be manually closed.
5) On the 30-minute timeframe, trades based on MACD signals are only advisable amidst substantial volatility and an established trend, confirmed either by a trendline or trend channel.
6) If two levels lie closely together (ranging from 5 to 15 pips apart), they should be considered as a support or resistance zone.
Support and Resistance price levels can serve as targets when buying or selling. You can place Take Profit levels near them.
Red lines represent channels or trend lines, depicting the current market trend and indicating the preferable trading direction.
The MACD(14,22,3) indicator, encompassing both the histogram and signal line, acts as an auxiliary tool and can also be used as a signal source.
Significant speeches and reports (always noted in the news calendar) can profoundly influence the price dynamics. Hence, trading during their release calls for heightened caution. It may be reasonable to exit the market to prevent abrupt price reversals against the prevailing trend.
Beginners should always remember that not every trade will yield profit. Establishing a clear strategy coupled with sound money management is the cornerstone of sustained trading success.
InstaForex analytical reviews will make you fully aware of market trends! Being an InstaForex client, you are provided with a large number of free services for efficient trading.

