 Stay
Stay 
Trading Conditions
Products
Tools


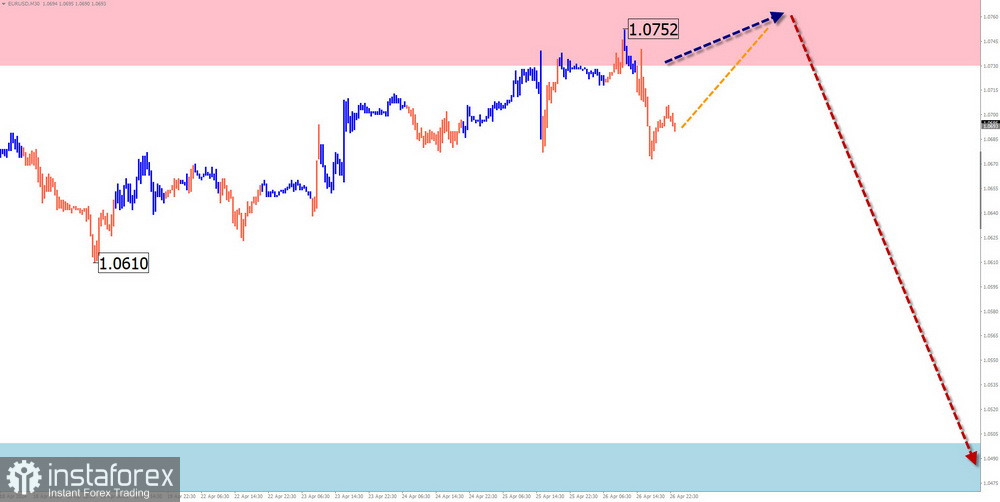
EUR/USD
Analysis:
Since July of last year, the quotes of the European currency have been weakening relative to the US dollar. The support zone of the daily scale, which was pressed a month ago, has turned into strong resistance. Along with this, the pair's quotes have been forming a correction before continuing the decline in recent weeks, which is not yet complete.
Forecast:
At the beginning of the upcoming week, a continuation of the flat movement along the calculated resistance levels for the European currency is expected. Increased volatility, a change in direction, and a resumption of price decline can be expected from the beginning of next month.
Potential Reversal Zones
Resistance:
Support:
Recommendations:
Buying: This has little potential and may lead to losses.
Selling: After the appearance of corresponding reversal signals near the resistance zone, sales may become the main direction for trading.
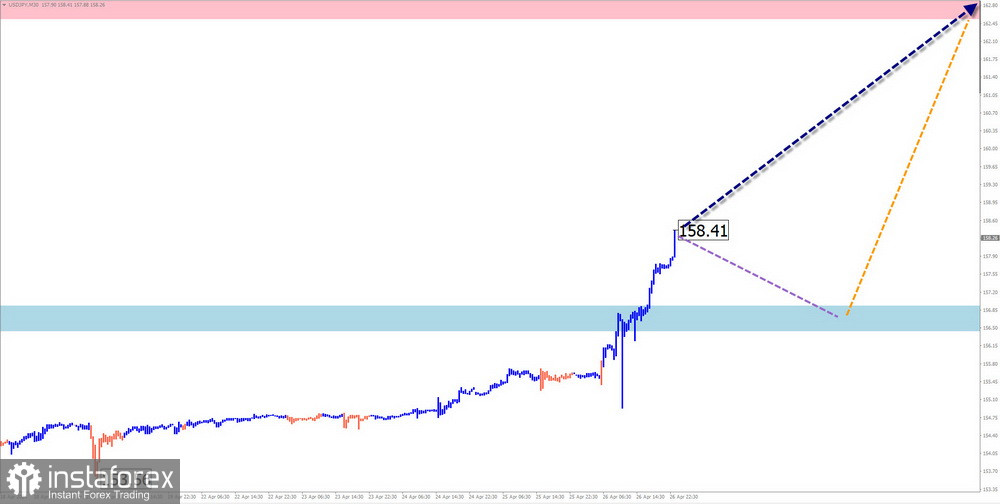
USD/JPY
Analysis:
The major pair of the Japanese yen continues to develop a bullish impulse on the chart. The trend of weakening of the Japanese currency continues. Since the beginning of March, the final, unfinished section has been developing. The calculated resistance passes at the lower boundary of a powerful potential reversal zone of the weekly TF.
Forecast:
Throughout the upcoming week, a continuation of the overall bullish price movement vector is expected. In the first few days, a sideways flat or a brief downward retracement to the support area is not excluded. The greatest volatility is likely towards the end of the week.
Potential Reversal Zones
Resistance:
Support:
Recommendations:
Buying: May be used in trading after the appearance of corresponding signals from your trading system.
Selling: There will be no conditions for such transactions in the upcoming week.
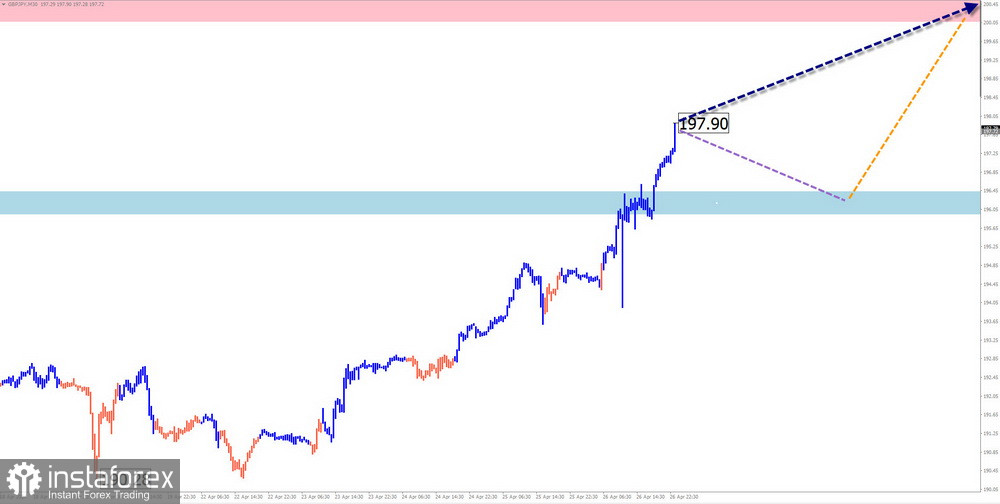
GBP/JPY
Analysis:
On the daily chart of the GBP/JPY pair, the formation of an ascending wave has been continuing since September of last year. The unfinished section of the short-term trend starts counting on April 12th. In the wave structure, the last part (C) is developing, lacking the final segment.
Forecast:
In the next couple of days, a sideways price movement vector for the cross is expected. A brief decline, not lower than the support boundaries, is not excluded. The resumption of the price increase is most likely in the second half of the week. The highest volatility may coincide with the release of economic data.
Potential Reversal Zones
Resistance:
Support:
Recommendations:
Selling: High-risk and may lead to deposit losses.
Buy: This may become the main direction for trading on this pair after the appearance of confirmed reversal signals on the trading systems you use.
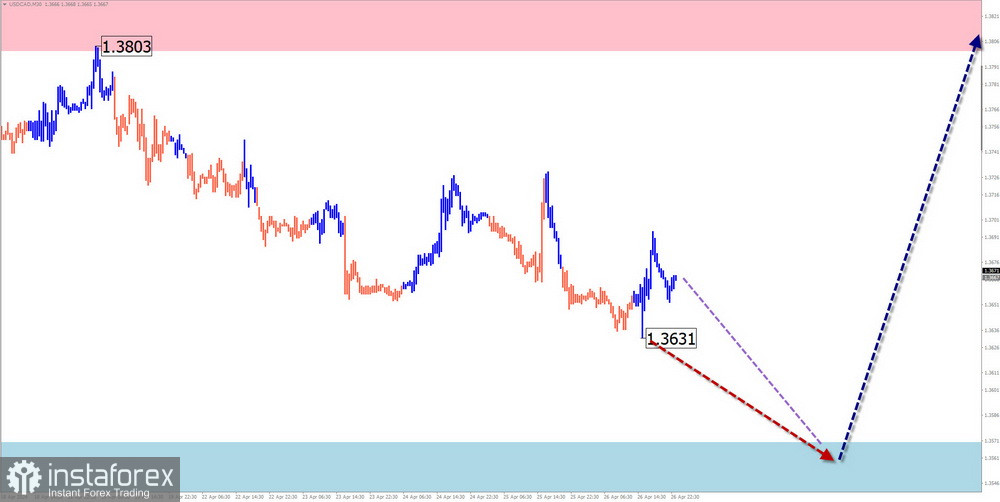
USD/CAD
Analysis:
The direction of price movements in the main Canadian dollar pair over the past couple of years is defined by a horizontal plane algorithm. The last section of this wave is directed upward. The price has reached the boundaries of a powerful potential reversal zone in the large TF. In mid-April, a section of the chart with reversal potential began to form downward. Quotes are stuck in a channel between areas in opposite directions.
Forecast:
In the next couple of days, a downward price movement vector is expected. The decline can be expected within the support boundaries. In the second half of the week, there is an increased chance of a reversal formation and a resumption of the price increase. The greatest activity is more likely closer to the weekend.
Potential Reversal Zones
Resistance:
Support:
Recommendations:
Selling: Fractional volumes may be used within individual sessions.
Buying: There are no conditions for such transactions until confirmed reversal signals appear in the support area.
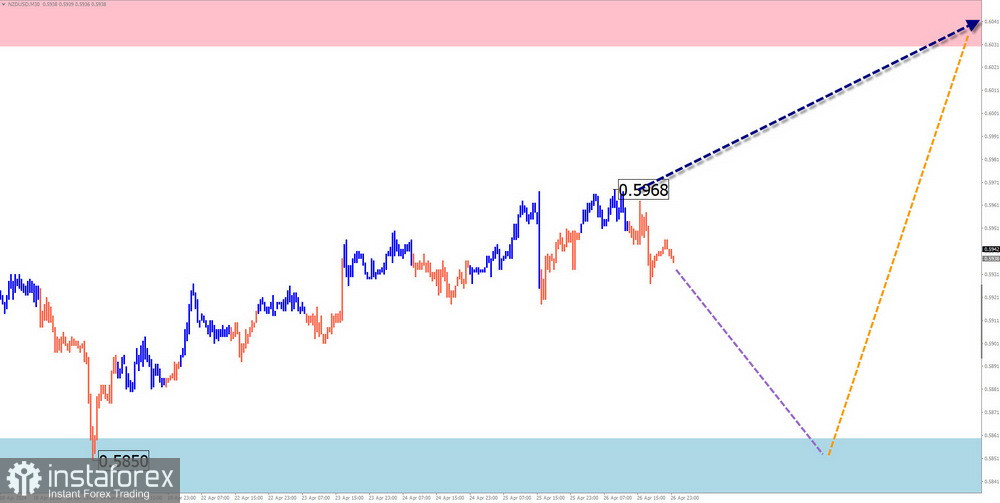
NZD/USD
Analysis:
Since last summer, a descending plane has defined the direction of price fluctuations for the major New Zealand dollar pair. On the chart, the extremes of the wave demonstrate the "horizontal pennant" pattern. The wave structure does not show completion at the time of analysis. The ascending section from April 19th has reversal potential.
Forecast:
At the beginning of the upcoming week, a flat movement vector with a downward trend is most likely. A decline can be expected in the calculated support boundaries. Closer to the weekend, a change in direction and a resumption of price increase may be expected against the background of increased overall instrument volatility.
Potential Reversal Zones
Resistance:
Support:
Recommendations:
Selling: Fractional volumes may be possible within individual sessions. The potential is limited by support.
Buying: This may be used in trading after confirmed reversal signals appear in the support zone.
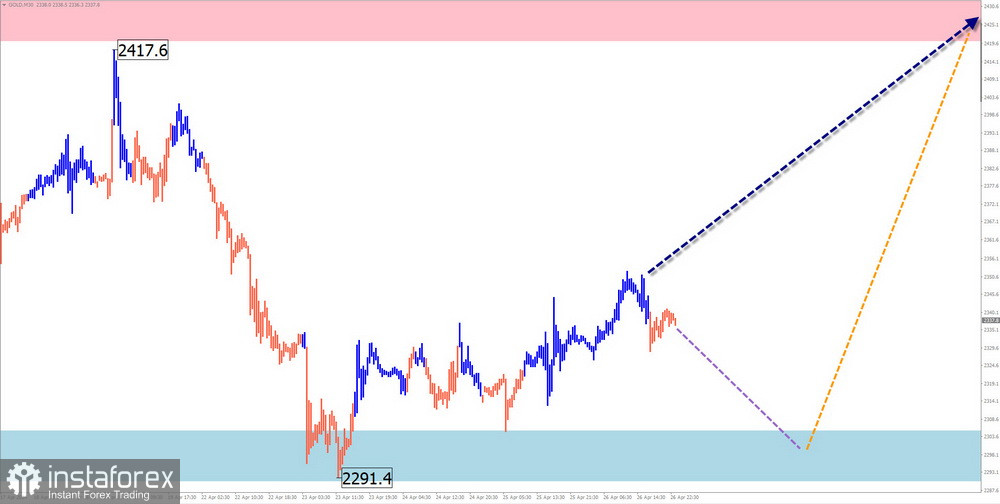
Gold
The price of gold continues its long-term upward trend. The unfinished section along the main course starts counting from October of last year. After updating all previous record highs in March, the gold price index chart went into a sideways drift.
Forecast:
Throughout the upcoming week, a continuation of the overall trend toward an increase in the instrument's price is expected. The first few days are more likely to have a downward price vector, with a decline not lower than the calculated support boundaries. The resumption of the upward price movement is more likely towards the end of the week.
Potential Reversal Zones
Resistance:
Support:
Recommendations:
Selling: Carry a high degree of risk, which may lead to losses.
Buying: After confirmed reversal signals appear, they may be used for trading transactions.
Explanation: In simplified wave analysis (SWA), all waves consist of 3 parts (A-B-C). The last unfinished wave is analyzed at each TF. Dashed lines show expected movements.
Attention: The wave algorithm does not take into account the duration of movements in time!
InstaForex analytical reviews will make you fully aware of market trends! Being an InstaForex client, you are provided with a large number of free services for efficient trading.

