 Stay
Stay 
Trading Conditions
Products
Tools


The EUR/USD pair showed dishonorable movements on Wednesday. First of all, the market ignored all the "important" US reports. Secondly, the price initially consolidated below the ascending channel and then it started a new upward movement. Thirdly, Federal Reserve Chair Jerome Powell's speech cannot be considered dovish, but the dollar still fell. Fourthly, the pair remained in a flat range throughout the day. Lastly, volatility, for a day with four significant reports and an FOMC meeting, was low.
To be fair, take note that two out of the four reports turned out worse than expected. The JOLTS job openings in March were less than what the market anticipated, and the ISM Manufacturing PMI fell below forecasts. However, the two other reports exceeded market expectations. But before the FOMC meeting results were announced, volatility was just equal to 30 pips...
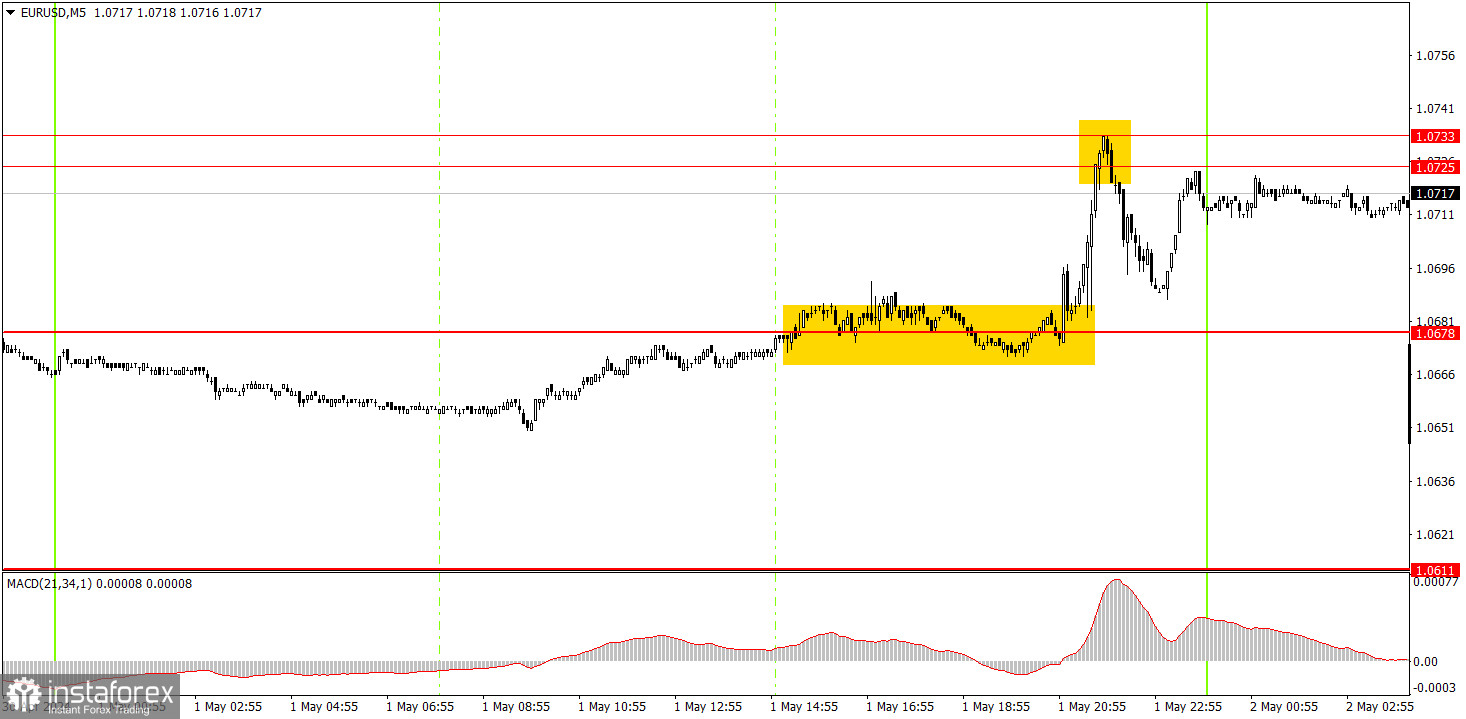
The first trading signal on the 5-minute timeframe was formed late in the evening. In general, the pair started to move after the announcement of the FOMC meeting results and Powell's speech. Novice traders could enter the market after the price overcame the level of 1.0678 and after the bounce from the area of 1.0725-1.0733. Both trading signals turned out to be profitable. However, traders should be very cautious during such important events like central bank meetings. For instance, the dollar fell when it could have shown growth, judging by Powell's statements.
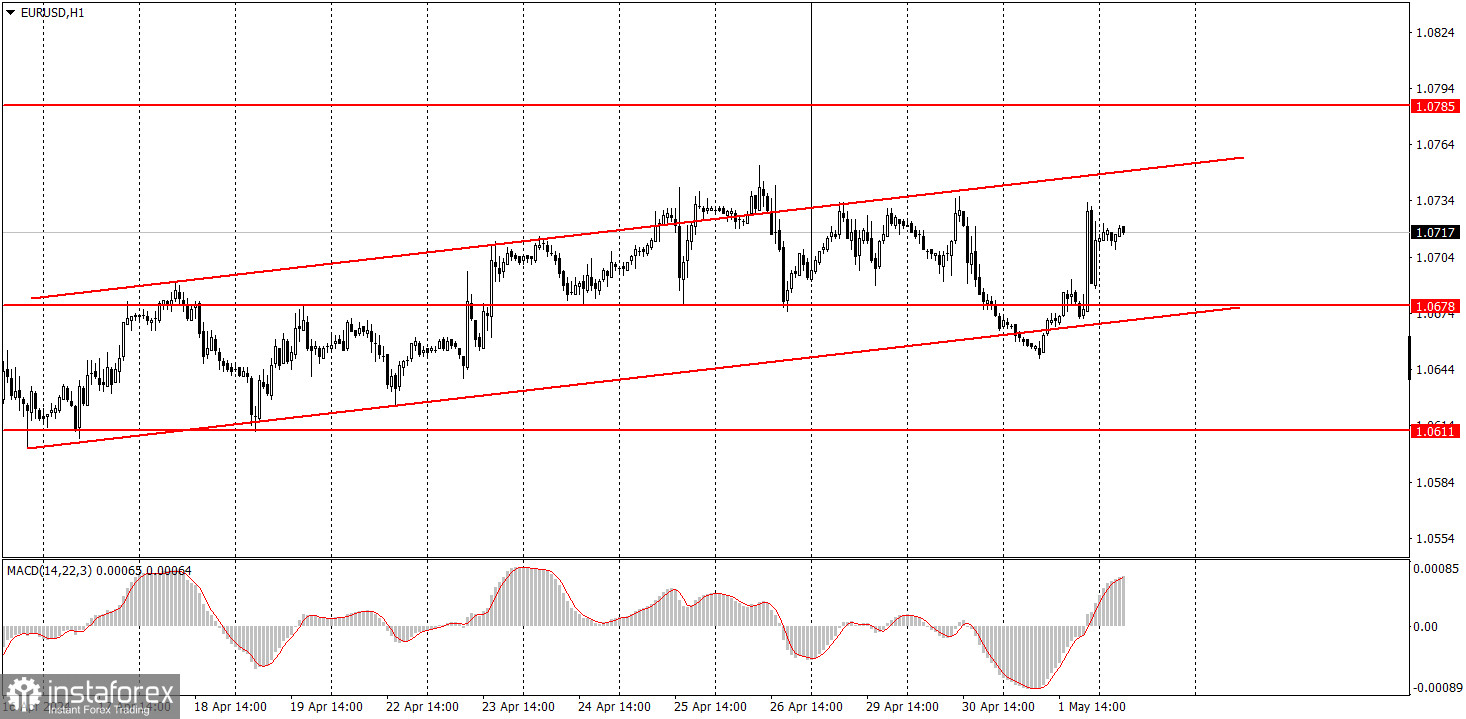
On the hourly chart, the EUR/USD pair is correcting higher. We believe that the euro should continue to fall in the medium term, as it remains relatively high, and in general, the trend is headed downwards. The fundamental background still works in favor of the US dollar, and yesterday's events even supported this – now the Federal Reserve doesn't even know when monetary policy easing will begin.
Today, the pair may resume its decline, as the market had an illogical reaction to the FOMC meeting. The pair has already breached the lower boundary of the channel, so we expect the price to fall towards the target of 1.0611. You could also consider trading from the area of 1.0725-1.0733.
The key levels on the 5M chart are 1.0483, 1.0526, 1.0568, 1.0611, 1.0678, 1.0725-1.0733, 1.0785-1.0797, 1.0838-1.0856, 1.0888-1.0896, 1.0940, 1.0971-1.0981. Today, the second estimates of the Manufacturing PMIs of Germany and the EU for April are scheduled for release. The US docket will feature the number of initial jobless claims. All these reports are secondary of importance, so we do not expect a strong market reaction.
1) Signal strength is determined by the time taken for its formation (either a bounce or level breach). A shorter formation time indicates a stronger signal.
2) If two or more trades around a certain level are initiated based on false signals, subsequent signals from that level should be disregarded.
3) In a flat market, any currency pair can produce multiple false signals or none at all. In any case, the flat trend is not the best condition for trading.
4) Trading activities are confined between the onset of the European session and mid-way through the U.S. session, after which all open trades should be manually closed.
5) On the 30-minute timeframe, trades based on MACD signals are only advisable amidst substantial volatility and an established trend, confirmed either by a trendline or trend channel.
6) If two levels lie closely together (ranging from 5 to 15 pips apart), they should be considered as a support or resistance zone.
Support and Resistance price levels can serve as targets when buying or selling. You can place Take Profit levels near them.
Red lines represent channels or trend lines, depicting the current market trend and indicating the preferable trading direction.
The MACD(14,22,3) indicator, encompassing both the histogram and signal line, acts as an auxiliary tool and can also be used as a signal source.
Significant speeches and reports (always noted in the news calendar) can profoundly influence the price dynamics. Hence, trading during their release calls for heightened caution. It may be reasonable to exit the market to prevent abrupt price reversals against the prevailing trend.
Beginning traders should always remember that not every trade will yield profit. Establishing a clear strategy coupled with sound money management is the cornerstone of sustained trading success.
InstaForex analytical reviews will make you fully aware of market trends! Being an InstaForex client, you are provided with a large number of free services for efficient trading.


