 Stay
Stay 
Trading Conditions
Products
Tools


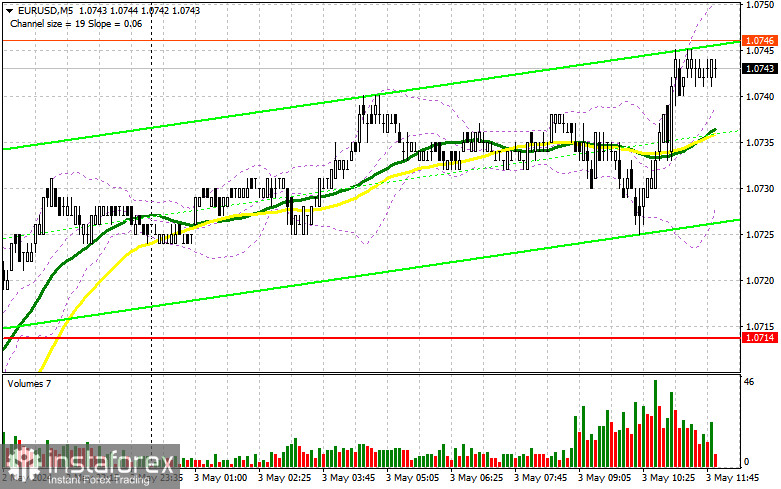
In my morning forecast, I drew attention to the level of 1.0751 and planned to make decisions regarding market entry based on it. Let's take a look at the 5-minute chart and analyze what happened there. Growth occurred, but due to low volatility, we have yet to reach a test of this range. Consequently, suitable entry points into the market still needed to be achieved. The technical picture still needs to be revised for the second half of the day.
For opening long positions on EUR/USD, the following is required:
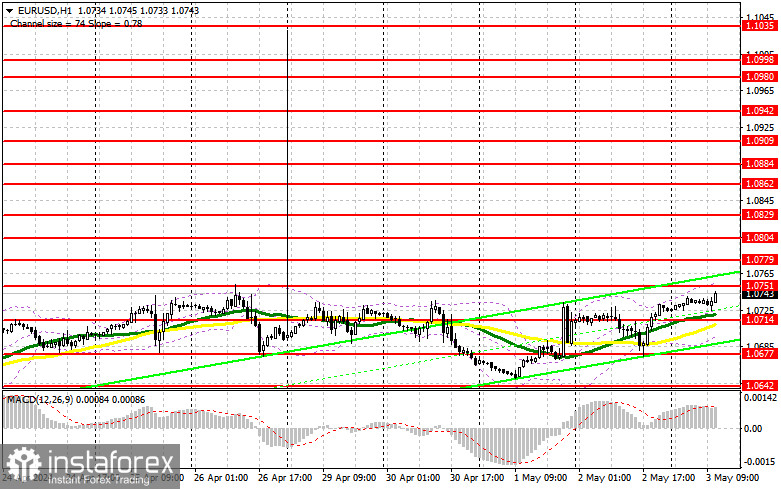
The absence of important statistics for the eurozone became a key point due to the low trading volume and weak volatility of the pair. But ahead of us are important data on the US labor market, so there will be movement. Figures on the unemployment rate and changes in the number of employed in the non-agricultural sector are expected. The dynamics of job creation are very important: a sharp increase above economists' expectations will lead to a decline in the pair, while weak statistics and a low number of new jobs will lead to obvious euro purchases and the pair breaking out of the sideways channel. In addition, attention should be paid to changes in average hourly earnings and the ISM Business Activity Index for the services sector. Strong indicators will lead to a decline and a test of the strength of the level at 1.0714, around which the moving averages are located, playing on the bull side. Only the formation of a false breakout there will provide an entry point into long positions capable of pushing the euro towards the area of significant resistance at 1.0751, which we did not reach today. Breaking and updating this range from top to bottom will lead to the formation of a new bull market and a buy signal with a chance to surge to 1.0779. The ultimate target will be the maximum at 1.0804, where I will take profit. In the case of a decline in EUR/USD and lack of activity around 1.0714 against the backdrop of very strong statistics, pressure on the euro within the medium-term bearish trend will return. In this case, I will enter the market only after the formation of a false breakout around the next support at 1.0677. I plan to open long positions immediately on the rebound from 1.0642, with a target of an upward correction of 30-35 points within the day.
For opening short positions on EUR/USD, the following is required:
Euro sellers also have all the chances for the pair to decline. If US data turns out to be too weak, I would like to see the manifestation of sellers around the significant resistance at 1.0751. The formation of a false breakout would be an excellent scenario for entering short positions with the aim of a decline to around 1.0714 – intermediate support, where the moving averages are also located, playing on the buyer's side. Breaking and consolidating below this range, along with a reverse test from bottom to top, will provide another selling point, with the pair moving towards 1.0677. I expect more active manifestations of large buyers there. The ultimate target will be the minimum at 1.0642, where I will take profit. In the case of upward movement of EUR/USD in the second half of the day, as well as the absence of bears at 1.0751, bears will say goodbye to the hope of regaining control of the market. In this case, I will postpone sales until testing the next resistance at 1.0779. I will also sell there, but only after an unsuccessful consolidation. I plan to open short positions immediately on the rebound from 1.0804 with a target of a downward correction of 30-35 points.
Indicator Signals:
Moving Averages
Trading is conducted above the 30 and 50-day moving averages, indicating further pair growth.
Note: The period and prices of the moving averages are considered by the author on the hourly chart H1 and differ from the general definition of classical daily moving averages on the daily chart D1.
Bollinger Bands
In the event of a decline, the lower boundary of the indicator at around 1.0710 will act as support.
Description of Indicators:
• Moving Average (determines the current trend by smoothing out volatility and noise). Period 50. Marked in yellow on the chart.
• Moving Average (determines the current trend by smoothing out volatility and noise). Period 30. Marked in green on the chart.
• MACD Indicator (Moving Average Convergence/Divergence) Fast EMA period 12. Slow EMA period 26. SMA period 9.
• Bollinger Bands. Period 20.
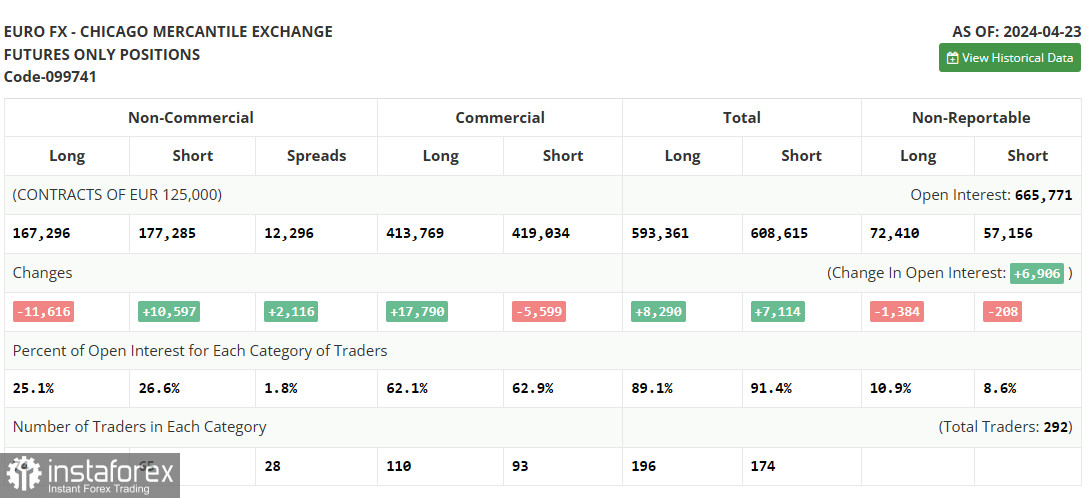
• Non-commercial traders - speculators, such as individual traders, hedge funds, and large institutions using the futures market for speculative purposes and meeting certain requirements.
• Long non-commercial positions represent the total long open position of non-commercial traders.
• Short non-commercial positions represent the total short open position of non-commercial traders.
• The total non-commercial net position is the difference between short and long positions of non-commercial traders.
InstaForex analytical reviews will make you fully aware of market trends! Being an InstaForex client, you are provided with a large number of free services for efficient trading.

