 Stay
Stay 
Trading Conditions
Products
Tools


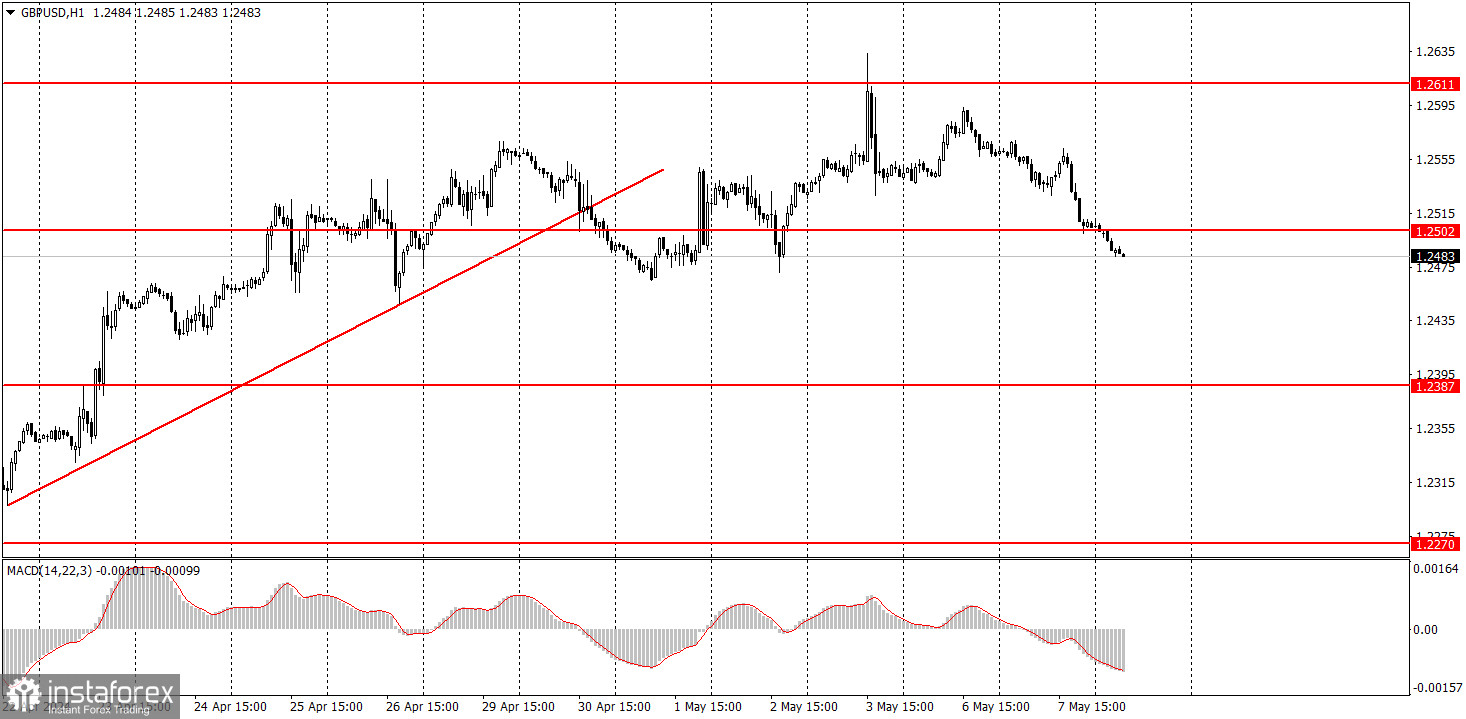
Yesterday, the GBP/USD pair continued its downward movement after rebounding from the level of 1.2611 last Friday. The price has previously breached the ascending trend line, indicating the end of the upward trend, which was corrective in nature. Looking at higher time frames, its clear that the pair will follow a downward move in the medium-term. Therefore, we expect the pound to resume the decline.
Neither the UK nor the US published any reports on Tuesday. In the US, several Federal Reserve officials spoke, and it became apparent that there will be no talk of rate cuts in the near future. This indicates that the US dollar still has a stronger fundamental background compared to the British pound. However, the Bank of England meeting is scheduled this week, and the central bank may soften its stance on monetary policy. With inflation decreasing in the UK, BoE Governor Andrew Bailey's rhetoric may take on a more dovish tone. If this happens, the British pound will have new reasons to fall.
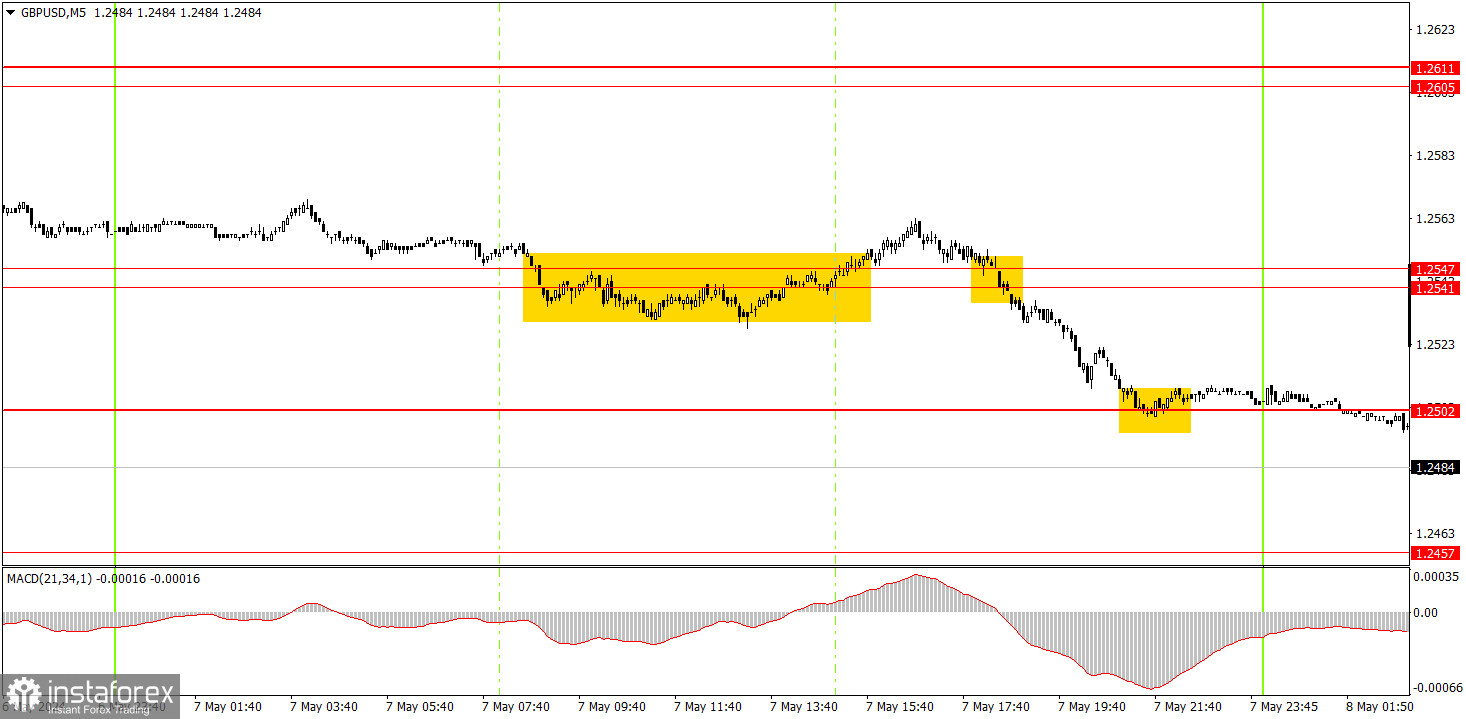
Two trading signals were generated on the 5-minute timeframe, with another one occurring overnight. Initially, the price rebounded from the range of 1.2541-1.2547, but this turned out to be a false signal and resulted in a small loss. Then the price breached the range of 1.2541-1.2547, and the pair fell to the level of 1.2502. Novice traders could have earned about 30 pips on this trade. Overnight, the pair breached the level of 1.2502, so short positions could be kept open or new ones could be opened in the morning while aiming for 1.2457.
On the hourly chart, the GBP/USD pair has excellent prospects for forming a downward trend, and the corrective phase may finally end. The fundamental backdrop continues to support the dollar much more than the British pound. Therefore, we only expect downward movement from the pair. If the BoE does not disappoint the market with hawkish rhetoric and its decisions this week, we expect the pound to fall further.
On Wednesday, investors can initiate trade from the level of 1.2502, which the price has already surpassed. Therefore, short positions are more relevant for today.
The key levels on the 5M chart are 1.2270, 1.2310, 1.2372-1.2387, 1.2457, 1.2502, 1.2541-1.2547, 1.2605-1.2611, 1.2648, 1.2691, 1.2725, 1.2787-1.2791. Today, there are no events or reports scheduled in the UK or the US. Therefore, we don't expect strong movements, but the pound may continue to fall, as it is now easier to expect the BoE to soften its stance.
1) Signal strength is determined by the time taken for its formation (either a bounce or level breach). A shorter formation time indicates a stronger signal.
2) If two or more trades around a certain level are initiated based on false signals, subsequent signals from that level should be disregarded.
3) In a flat market, any currency pair can produce multiple false signals or none at all. In any case, the flat trend is not the best condition for trading.
4) Trading activities are confined between the onset of the European session and mid-way through the U.S. session, after which all open trades should be manually closed.
5) On the 30-minute timeframe, trades based on MACD signals are only advisable amidst substantial volatility and an established trend, confirmed either by a trendline or trend channel.
6) If two levels lie closely together (ranging from 5 to 15 pips apart), they should be considered as a support or resistance zone.
Support and Resistance price levels can serve as targets when buying or selling. You can place Take Profit levels near them.
Red lines represent channels or trend lines, depicting the current market trend and indicating the preferable trading direction.
The MACD(14,22,3) indicator, encompassing both the histogram and signal line, acts as an auxiliary tool and can also be used as a signal source.
Significant speeches and reports (always noted in the news calendar) can profoundly influence the price dynamics. Hence, trading during their release calls for heightened caution. It may be reasonable to exit the market to prevent abrupt price reversals against the prevailing trend.
Beginners should always remember that not every trade will yield profit. Establishing a clear strategy coupled with sound money management is the cornerstone of sustained trading success.
InstaForex analytical reviews will make you fully aware of market trends! Being an InstaForex client, you are provided with a large number of free services for efficient trading.

