 Stay
Stay 
Trading Conditions
Products
Tools


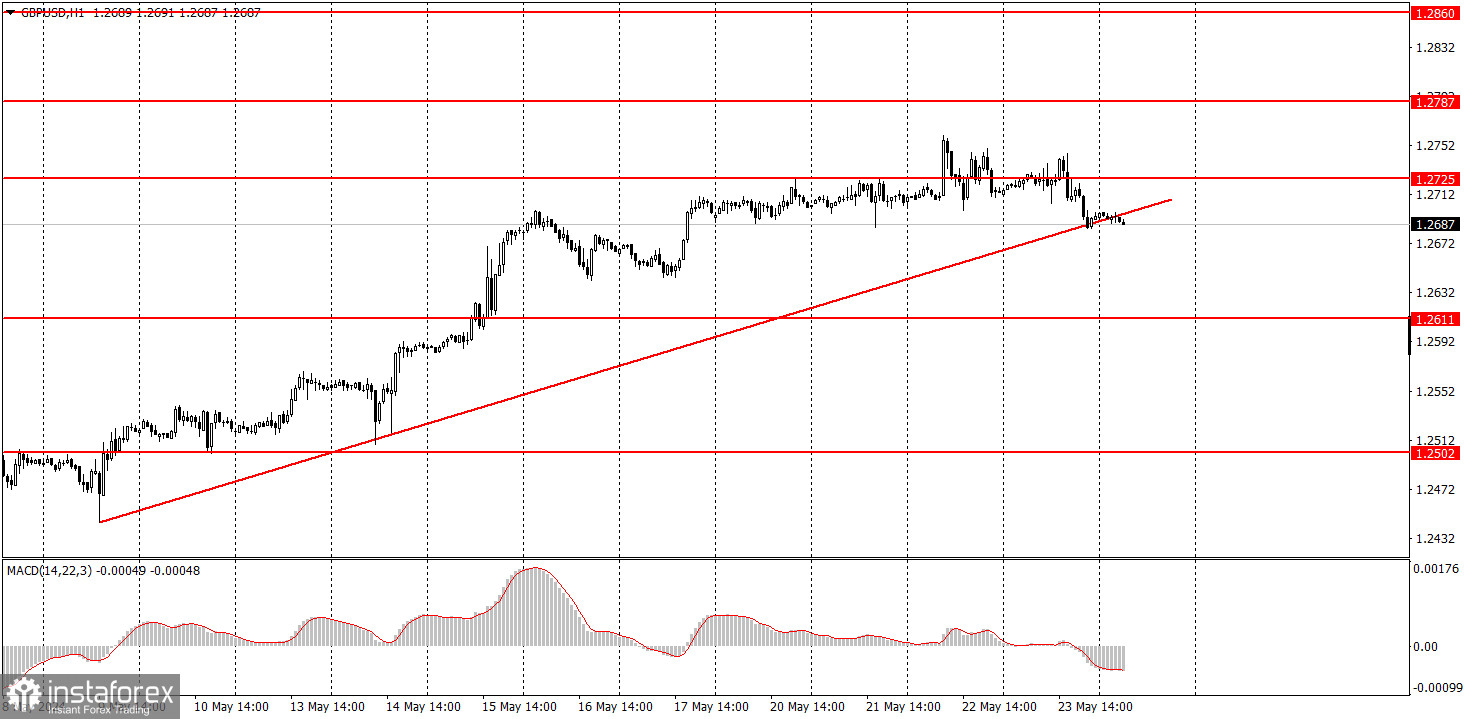
GBP/USD edged lower on Thursday. The chart above perfectly shows that the pair has not exhibited a downward movement in the last 11 trading days. The pound is rising with the fundamentals, without the fundamentals, without the macroeconomic background, contrary to the fundamental background. There is no logic behind the movements, although, from a technical perspective, they may look quite appealing. For instance, we clearly have an upward trend on the hourly timeframe, which is begging to be worked out. But we have already mentioned that the pair's volatility remains low, and it is very difficult to buy the pound when reports and fundamentals indicate a reversal.
Yesterday, the UK PMI data turned out to be mixed. The services sector fell below forecasts, while the manufacturing sector grew. In the second half of the day, the US released its own PMI data, which turned out to be better than forecasts. So at the end of the day, the dollar rose by 15 pips.
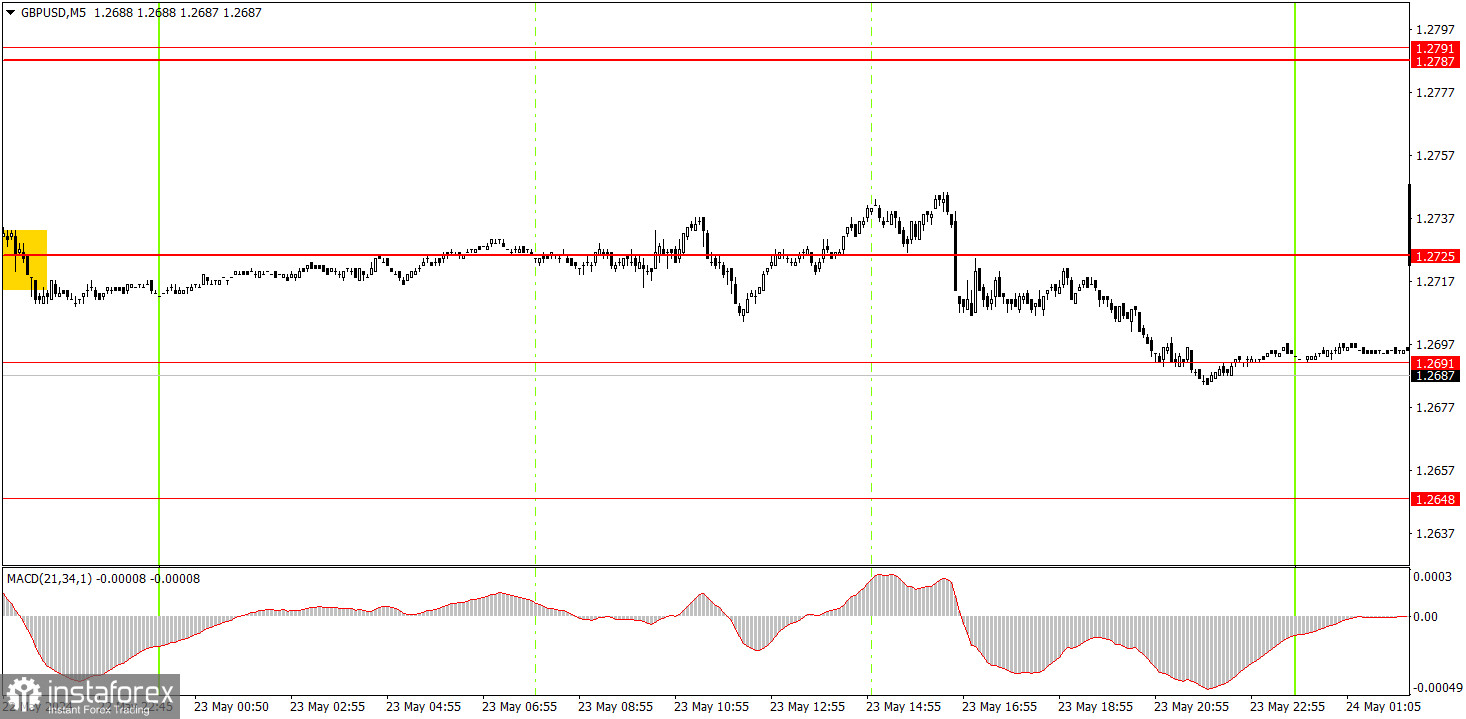
The pair continued to trade in a hectic manner on the 5-minute timeframe. Even if we ignore the levels, it is perfectly clear that the price changed its direction three or four times during the day. The pair only managed to fall towards the end of the day, but during the rest of the day it was a roller coaster without volatility. We saw the exact same picture on Wednesday. Therefore, the conclusion is obvious: even when the dollar has chances to correct higher, the market starts to stagger, as if traders feel that there is no need to push for the dollar's growth. We did not mark the trading signals since the pound moved from side to side and we also saw almost the same amount of volatility for the second consecutive day.
On the hourly chart, the GBP/USD pair has great prospects for forming a downward trend, but the bullish correction remains intact. The fundamental backdrop continues to support the dollar much more than the British pound, but the pound continues to rise. Reports and speeches do not always support the pound, but the market interprets almost all the news in favor of the British currency.
If we are talking about logical movements, then we expect the pound to fall on Friday, but considering the fact that the market does not need any reason to buy, the pound can still rise. Overcoming the trend line will not necessarily mean that a downward movement will follow.
The key levels on the 5M chart are 1.2270, 1.2310, 1.2372-1.2387, 1.2457, 1.2502, 1.2541-1.2547, 1.2605-1.2611, 1.2648, 1.2691, 1.2725, 1.2787-1.2791. Today, the UK retail sales reports will be released and the US docket will feature reports on durable goods orders and consumer sentiment from the University of Michigan.
1) Signal strength is determined by the time taken for its formation (either a bounce or level breach). A shorter formation time indicates a stronger signal.
2) If two or more trades around a certain level are initiated based on false signals, subsequent signals from that level should be disregarded.
3) In a flat market, any currency pair can produce multiple false signals or none at all. In any case, the flat trend is not the best condition for trading.
4) Trading activities are confined between the onset of the European session and mid-way through the U.S. session, after which all open trades should be manually closed.
5) On the 30-minute timeframe, trades based on MACD signals are only advisable amidst substantial volatility and an established trend, confirmed either by a trendline or trend channel.
6) If two levels lie closely together (ranging from 5 to 15 pips apart), they should be considered as a support or resistance zone.
Support and Resistance price levels can serve as targets when buying or selling. You can place Take Profit levels near them.
Red lines represent channels or trend lines, depicting the current market trend and indicating the preferable trading direction.
The MACD(14,22,3) indicator, encompassing both the histogram and signal line, acts as an auxiliary tool and can also be used as a signal source.
Significant speeches and reports (always noted in the news calendar) can profoundly influence the price dynamics. Hence, trading during their release calls for heightened caution. It may be reasonable to exit the market to prevent abrupt price reversals against the prevailing trend.
Beginners should always remember that not every trade will yield profit. Establishing a clear strategy coupled with sound money management is the cornerstone of sustained trading success.
InstaForex analytical reviews will make you fully aware of market trends! Being an InstaForex client, you are provided with a large number of free services for efficient trading.

