 Stay
Stay 
Trading Conditions
Products
Tools


EUR/USD traded lower on Friday. The correction against the correction started more than a week ago. In regards to the small correction, the price managed to fall by about 80 pips, while in the larger correction, the euro dropped around 260 pips in a month. Thus, volatility remains quite weak. However, the pair could have continued the downward movement on Friday, but the market decided otherwise.
There were no events or reports in the Eurozone, except for the second estimate of Germany's GDP numbers for Q1. On the other hand, the US published quite important reports on durable goods orders and consumer sentiment from the University of Michigan. Both reports turned out better than forecasts, and we remember that the important comparison is not with the previous month but with the forecast. So, two out of two reports were in favor of the dollar, and it steadily fell all day long. Basically, this is all you need to know about the market's reaction pattern to fundamental and macroeconomic backgrounds.
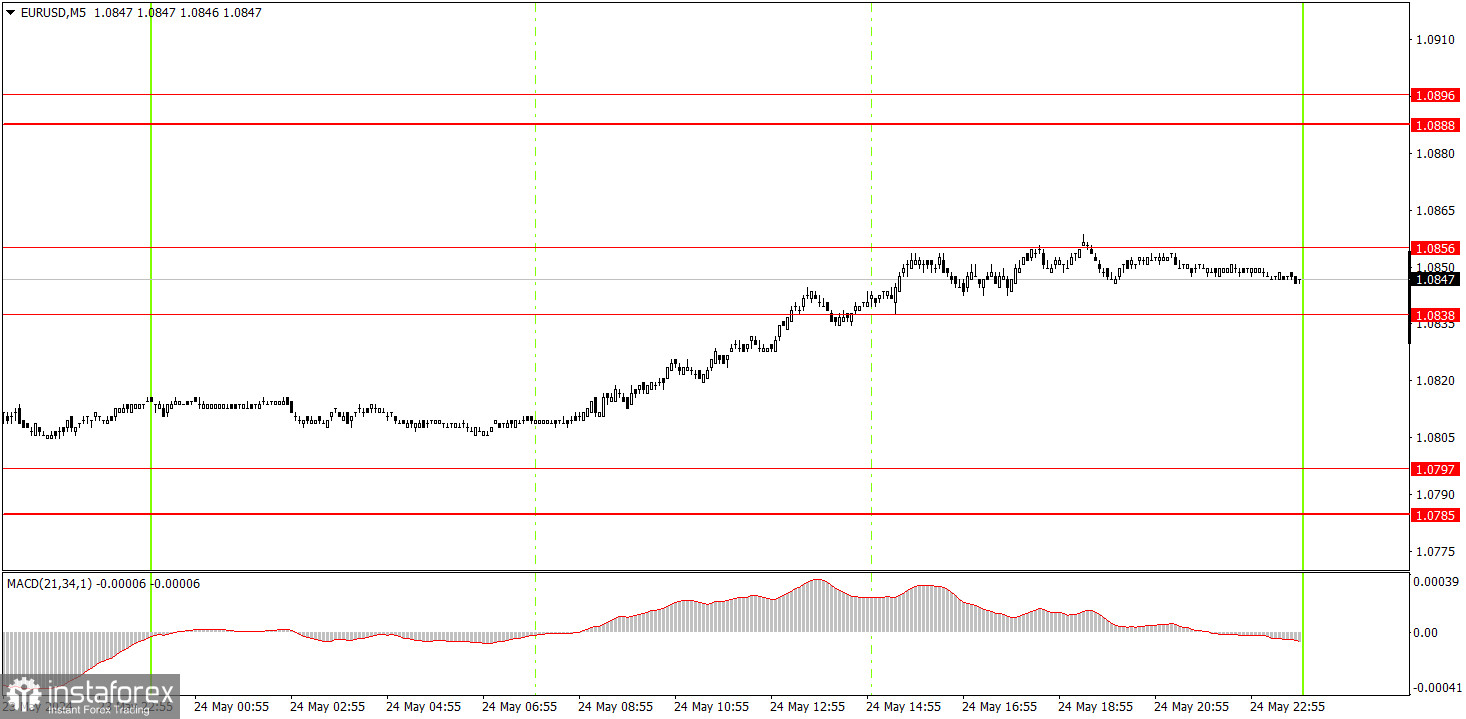
No trading signals were formed on the 5-minute timeframe. During the US trading session, the price entered the area of 1.0838-1.0856, where it traded until the market closed. On Monday, exiting this area will generate a signal, but volatility is usually very low on Mondays, so the pair could show very weak movement if it aims to move in the intended direction.
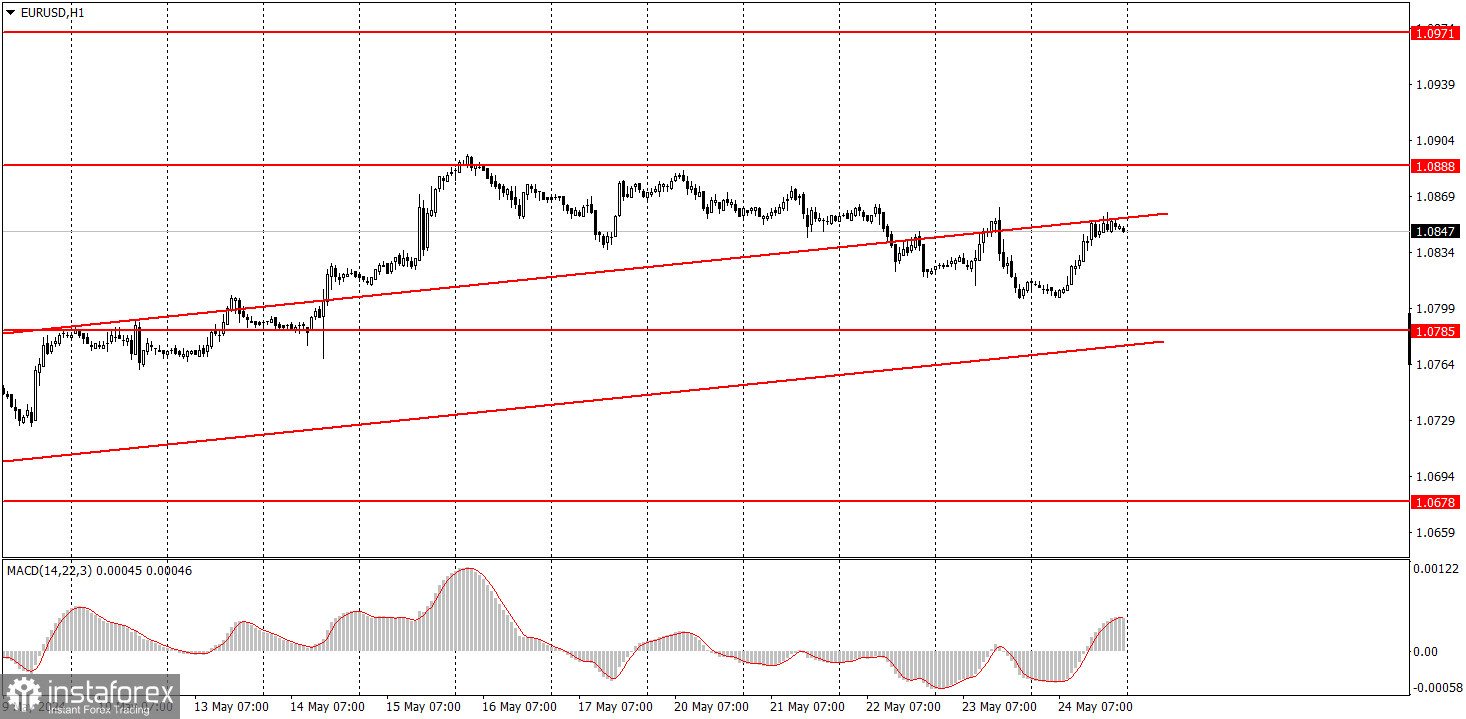
On the hourly chart, the bullish correction remains intact, which increasingly resembles an independent trend. We believe that the euro should fall in the medium term, and the global trend is downward. Nevertheless, the market still refuses to buy the dollar for unknown reasons and volatility also remains low.
On Monday, novice traders can look for signals around the area of 1.0838-1.0856. Since the pair has started moving downwards, you may prioritize sell signals. But we should take note of the weak volatility.
The key levels on the 5M chart are 1.0483, 1.0526, 1.0568, 1.0611, 1.0678, 1.0725-1.0733, 1.0785-1.0797, 1.0838-1.0856, 1.0888-1.0896, 1.0940, 1.0971-1.0981. No important reports or events are scheduled in either the US or the Eurozone. Most likely, we will have another "boring Monday" with minor price changes.
1) Signal strength is determined by the time taken for its formation (either a bounce or level breach). A shorter formation time indicates a stronger signal.
2) If two or more trades around a certain level are initiated based on false signals, subsequent signals from that level should be disregarded.
3) In a flat market, any currency pair can produce multiple false signals or none at all. In any case, the flat trend is not the best condition for trading.
4) Trading activities are confined between the onset of the European session and mid-way through the U.S. session, after which all open trades should be manually closed.
5) On the 30-minute timeframe, trades based on MACD signals are only advisable amidst substantial volatility and an established trend, confirmed either by a trendline or trend channel.
6) If two levels lie closely together (ranging from 5 to 15 pips apart), they should be considered as a support or resistance zone.
Support and Resistance price levels can serve as targets when buying or selling. You can place Take Profit levels near them.
Red lines represent channels or trend lines, depicting the current market trend and indicating the preferable trading direction.
The MACD(14,22,3) indicator, encompassing both the histogram and signal line, acts as an auxiliary tool and can also be used as a signal source.
Significant speeches and reports (always noted in the news calendar) can profoundly influence the price dynamics. Hence, trading during their release calls for heightened caution. It may be reasonable to exit the market to prevent abrupt price reversals against the prevailing trend.
Beginning traders should always remember that not every trade will yield profit. Establishing a clear strategy coupled with sound money management is the cornerstone of sustained trading success.
InstaForex analytical reviews will make you fully aware of market trends! Being an InstaForex client, you are provided with a large number of free services for efficient trading.


