 Stay
Stay 
Trading Conditions
Products
Tools


GOLD
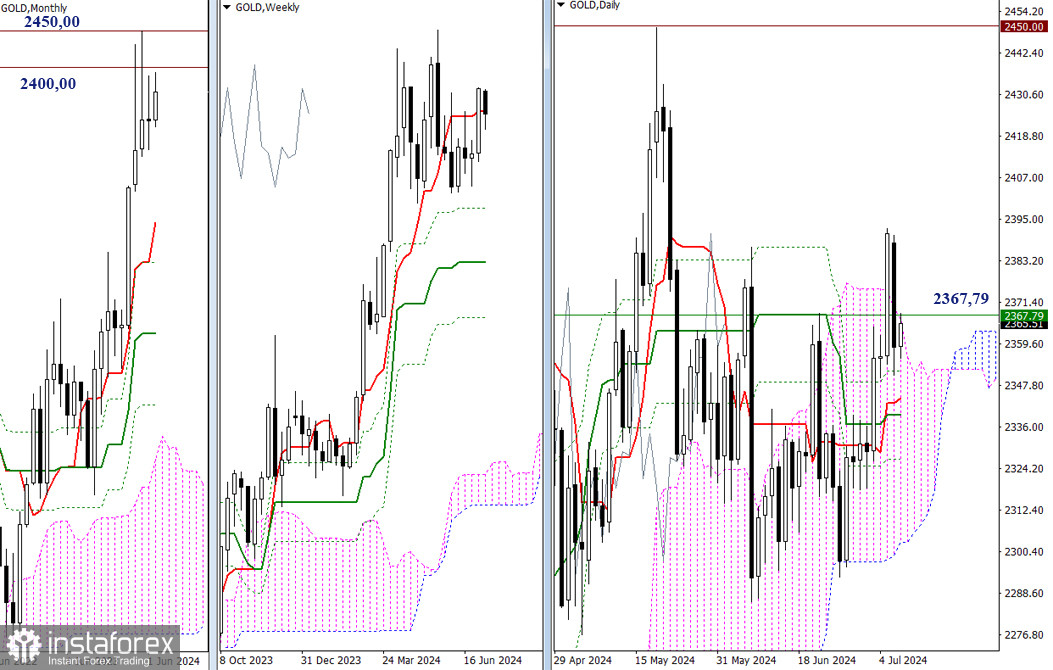
In April, the trading instrument reached and tested the psychological threshold of 2400.00. In May, the bulls made a new attempt, and gold managed to rise to the area of 2450.00, but it was the same result as April's. Hence, the two monthly candles have long upper shadows and this led to uncertainty in June. To change the situation and receive new prospects, the bulls must overcome the resistance at 2400.00 and 2450.00, firmly consolidating above these levels. The current influence, and containment at this section of the chart are also exerted by the weekly short-term trend (2367.79), supported by the cluster of daily levels in this area: 2351.89 - 2444.24 - 2339.37 - 2326.84 (Ichimoku cross) and 2366.65 - 2303.11 (Ichimoku cloud). To strengthen the bearish bias in the market, there should be a breakthrough of the daily cross and cloud.
H4 – H1
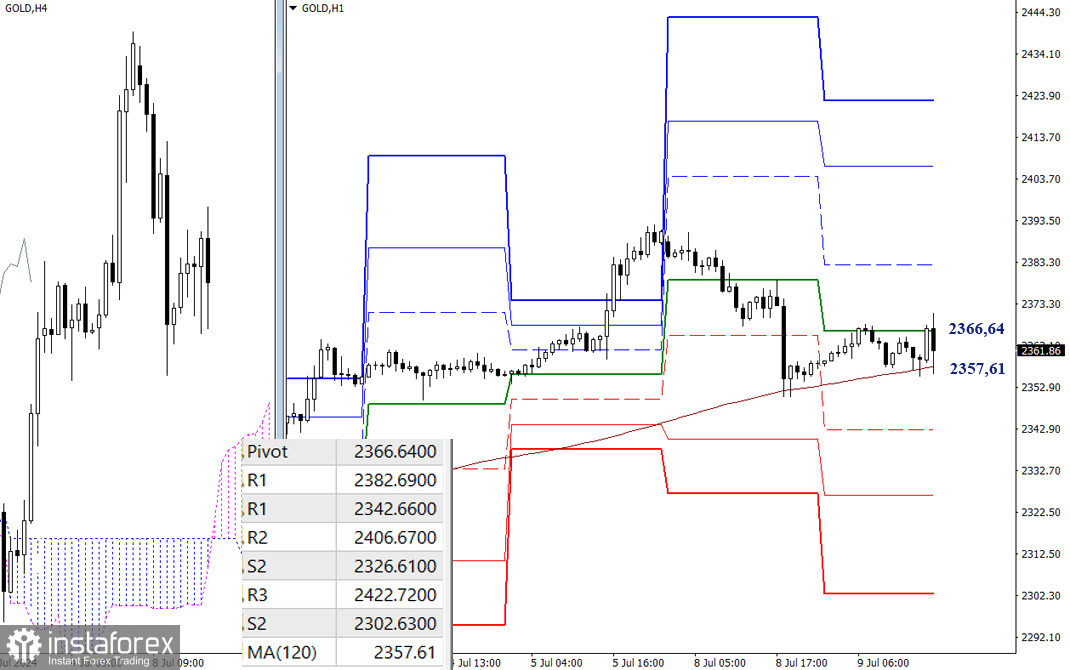
On the lower time frames, the trading instrument is currently in between two key levels. There is a struggle for control of the weekly long-term trend (2357.61). Consolidating below and reversing the trend will create good conditions to further strengthen the bearish bias. If the instrument continues to decline within the day, one can rely on the support of the classic Pivot levels (2342.66 - 2326.61 - 2302.63). In the event of a rebound and the bulls manage to recover their positions, the attention will shift to the resistance of the classic Pivot levels, which are located at 2382.69 - 2406.67 - 2422.72.
***
The technical analysis of the situation uses:
Higher timeframes - Ichimoku Kinko Hyo (9.26.52) + Fibonacci Kijun levels
Lower timeframes - H1 - Pivot Points (classic) + Moving Average 120 (weekly long-term trend)
InstaForex analytical reviews will make you fully aware of market trends! Being an InstaForex client, you are provided with a large number of free services for efficient trading.

