 Stay
Stay 
Trading Conditions
Products
Tools


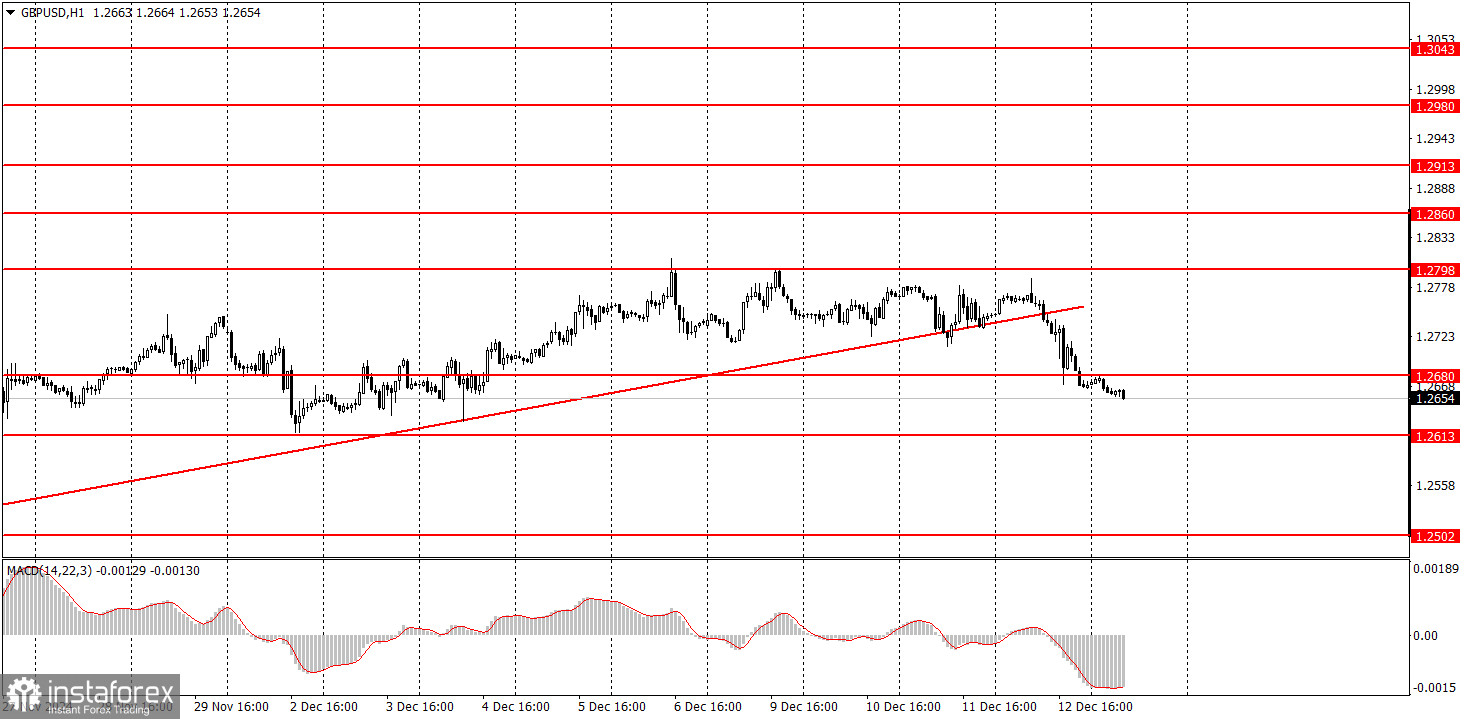
As expected, the GBP/USD pair traded lower on Thursday after the price consolidated below the ascending trendline. While this movement occurred within a flat phase, making the signal relatively weak, it still warned of an impending decline in the British pound. Yesterday's decline is not surprising. We have repeatedly emphasized that the pound remains overbought and unjustifiably expensive while global and local trends are bearish. Consequently, the end of the correction was likely to result in renewed depreciation of the British pound. There was virtually no significant news for the pound yesterday, but the market used the European Central Bank meeting as a trigger. Today, the UK will release several reports which are secondary in importance. Next week's Bank of England and Federal Reserve meetings will be significant events, though surprises are unlikely, and they are unlikely to alter the overall downtrend.

Several trading signals were generated in the 5-minute time frame on Thursday, mainly during the ECB meeting and Christine Lagarde's speech. As expected, these signals were imprecise due to frequent price reversals during that period. The most reliable signals were the bounce from the 1.2680–1.2685 area and the break below this area, which acted as a sell signal.
The GBP/USD pair appears to have completed its upward correction on the hourly time frame. In the medium term, we fully support a decline in the pound, considering it the only logical outcome. Therefore, further depreciation of the British currency is likely, regardless of the fundamental or macroeconomic backdrop.
On Friday, novice traders may expect a new round of declines in the British pound, as the price has consolidated below the ascending trendline and the 1.2680 level.
On the 5-minute time frame, the following levels can be used for trading: 1.2387, 1.2445, 1.2502–1.2508, 1.2547, 1.2633, 1.2680–1.2685, 1.2723, 1.2791–1.2798, 1.2848–1.2860, 1.2913, 1.2980–1.2993. The UK will release GDP and industrial production reports on Friday, but we view them as secondary. The U.S. economic calendar is empty today. If the price remains below 1.2680, further declines are highly likely.
Support and Resistance Levels: These are target levels for opening or closing positions and can also serve as points for placing Take Profit orders.
Red Lines: Channels or trendlines indicating the current trend and the preferred direction for trading.
MACD Indicator (14,22,3): A histogram and signal line used as a supplementary source of trading signals.
Important Events and Reports: Found in the economic calendar, these can heavily influence price movements. Exercise caution or exit the market during their release to avoid sharp reversals.
Forex trading beginners should remember that not every trade will be profitable. Developing a clear strategy and practicing proper money management are essential for long-term trading success.
InstaForex analytical reviews will make you fully aware of market trends! Being an InstaForex client, you are provided with a large number of free services for efficient trading.


