 Stay
Stay 
Trading Conditions
Products
Tools


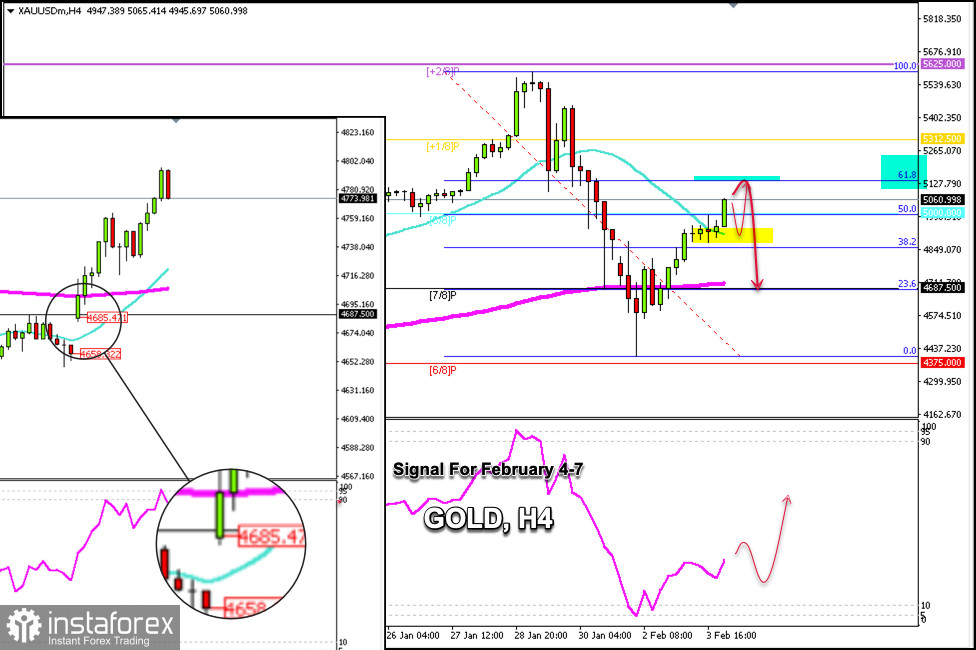
Gold is trading around the $5,060 level above the 8/8 Murray, above the SMA, showing bullish strength and reaching the 61.8% Fibonacci retracement zone.
If bullish strength prevails in the coming hours, gold could reach $5,130. This level could be seen as an area to open short positions and wait for the price to return to the 200 EMA around $4,687.
If the current price falls below the daily R1 located around $5,065, gold could experience a technical correction, and we could expect it to reach the 21 SMA located around $4,870. We could even expect the metal to return and cover the gap it left around $4,658.
Volatility in gold is strong, so we must be very careful and wait for strong resistance or strong support levels to open short or long positions.
Given that the Eagle indicator is showing positive signals, any pullback in the coming hours will be seen as an opportunity to continue buying gold.
If the price consolidates above the 61.8% Fibonacci level, gold is likely to continue its upward cycle and could reach the +1/8 Murray around $5,312.
If we look at the H4 chart, gold underwent a technical correction of more than $1,000 from its price of $5,600. This makes us believe that volatility could remain high over the coming weeks, and that the instrument is likely to continue falling. Gold left a gap in 2025 at about $3,600 that has not yet been covered, and this is likely to be the target for bears.
InstaForex analytical reviews will make you fully aware of market trends! Being an InstaForex client, you are provided with a large number of free services for efficient trading.


