 Stay
Stay 
Trading Conditions
Products
Tools


The EUR/USD currency pair continued its upward movement on Thursday, despite having fewer reasons to rise compared to earlier in the week. During the current week, the European currency has been consistently appreciating. But what has driven this growth? Jerome Powell reaffirmed the Federal Reserve's hawkish stance on two occasions. The recent inflation report reinforced Powell's belief that lowering the key interest rate anytime soon is not advisable.
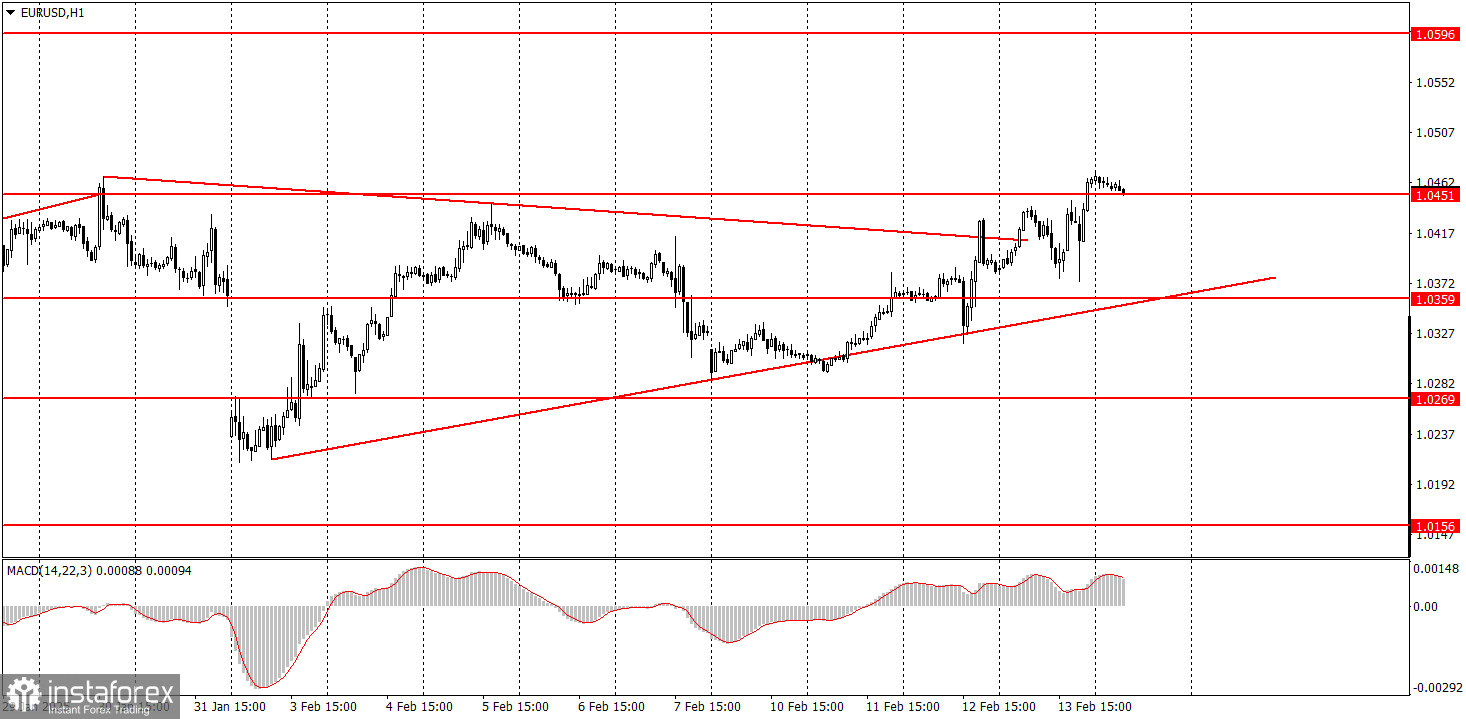
There were a few relatively positive reports from the Eurozone, particularly Thursday's industrial production report, which exceeded forecasts for the first time in a long while. However, it's worth questioning whether an industrial production report is more significant than the Federal Reserve's monetary policy. As we have previously noted, the upward correction is continuing on the daily timeframe, while on the hourly timeframe, trends are constantly alternating, resulting in chaotic and seemingly illogical movements. A new trendline has formed, providing support for the euro, but a breakdown below this line could occur at any moment—even today.
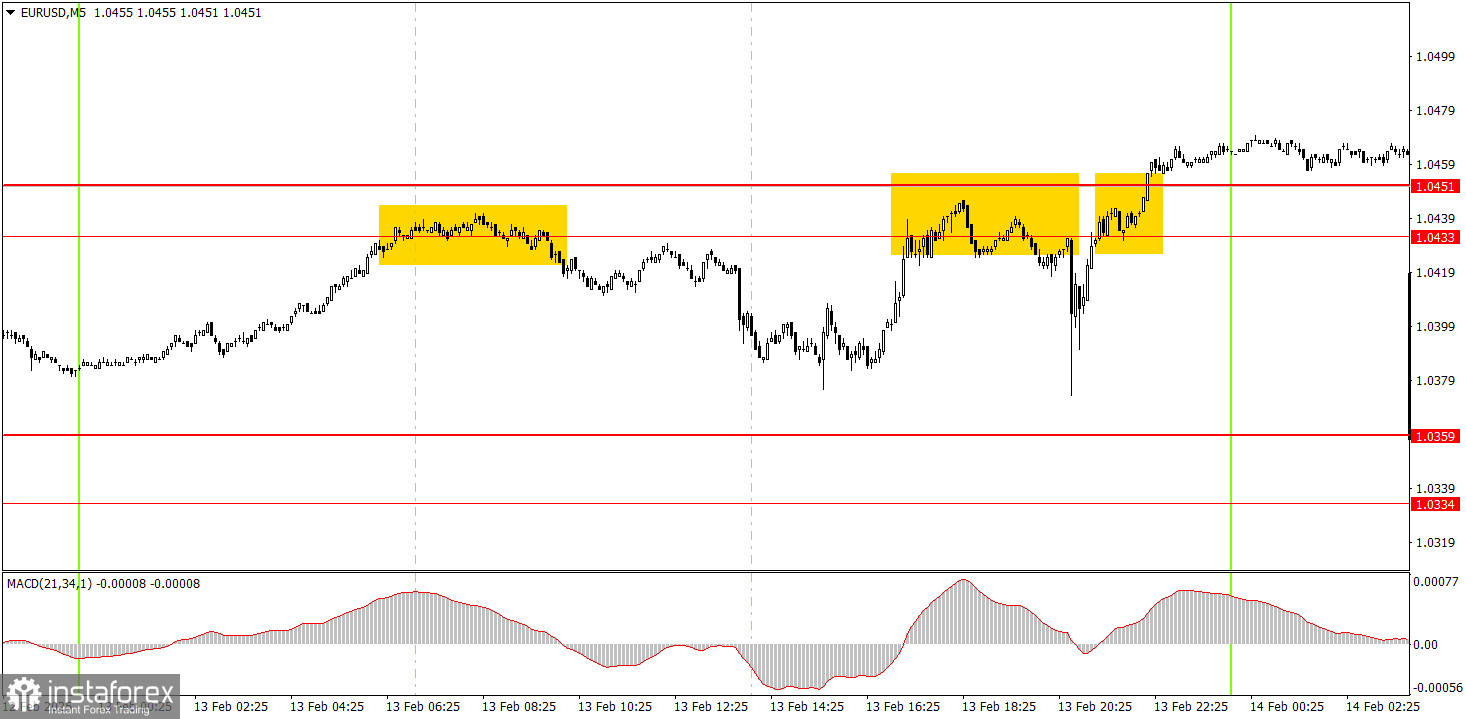
On the 5-minute timeframe, several trading signals emerged on Thursday. The price bounced off the 1.0433-1.0453 zone twice before breaking below it at the end of the day. The first sell signal, and to a lesser extent the second, could have been executed as short positions. However, in both cases, the pair failed to reach the nearest target. As a result, while these trades did not incur losses, they also offered minimal profit opportunities.
On the hourly timeframe, EUR/USD is currently in a medium-term downtrend. The previous local upward trend has been canceled, and a downward movement has resumed. A decline in the euro is anticipated as fundamental and macroeconomic factors continue to support the U.S. dollar. However, the upward correction on the daily timeframe may persist for several more weeks.
On Friday, the movements of the pair may be quite erratic due to the ongoing correction. Trading should be approached with caution, and decisions can be based on technical levels.
On the 5-minute timeframe, it is essential to monitor the following key levels: 1.0156, 1.0221, 1.0269-1.0277, 1.0334-1.0359, 1.0433-1.0451, 1.0526, 1.0596, 1.0678, 1.0726-1.0733, 1.0797-1.0804, and 1.0845-1.0851. On Friday, the Eurozone will release its second estimate for Q4 GDP, while the U.S. will publish reports on industrial production and retail sales. The GDP report is unlikely to influence market sentiment significantly, but the U.S. reports could have a notable impact.
Support and Resistance Levels: These are target levels for opening or closing positions and can also serve as points for placing Take Profit orders.
Red Lines: Channels or trendlines indicating the current trend and the preferred direction for trading.
MACD Indicator (14,22,3): A histogram and signal line used as a supplementary source of trading signals.
Important Events and Reports: Found in the economic calendar, these can heavily influence price movements. Exercise caution or exit the market during their release to avoid sharp reversals.
Forex trading beginners should remember that not every trade will be profitable. Developing a clear strategy and practicing proper money management are essential for long-term trading success.
InstaForex analytical reviews will make you fully aware of market trends! Being an InstaForex client, you are provided with a large number of free services for efficient trading.


