 Stay
Stay 
Trading Conditions
Products
Tools


Ethereum continues to trade in a range-bound market, closely mirroring Bitcoin's price action. Although there has been some minor upward movement in recent weeks, the overall structure remains flat. As previously discussed, Ethereum generally follows Bitcoin's trend, with differences only in the strength of movements, which are influenced by the Bitcoin Dominance Index. Currently, this index stands at 61.35%, indicating that the market prefers Bitcoin for buying during uptrends and is quicker to sell altcoins during declines. Since Bitcoin remains in a sideways range, Ethereum has also been unable to develop a clear trend.
Recently, the Bybit exchange was hacked, with $1.46 billion stolen, and Ethereum was one of the primary assets affected. However, this event did not significantly impact ETH/USD, as the decline was short-lived and remained within the established range. The market largely shrugged off the incident, suggesting that technical factors remain the primary driver.
From an ICT perspective, Bitcoin has triggered four bearish liquidity sweeps, while Ethereum has also removed liquidity multiple times. These repeated liquidity grabs suggest that both assets are preparing for a downward move, and the current sideways consolidation will not last forever.
ETH/USD Daily Chart Analysis
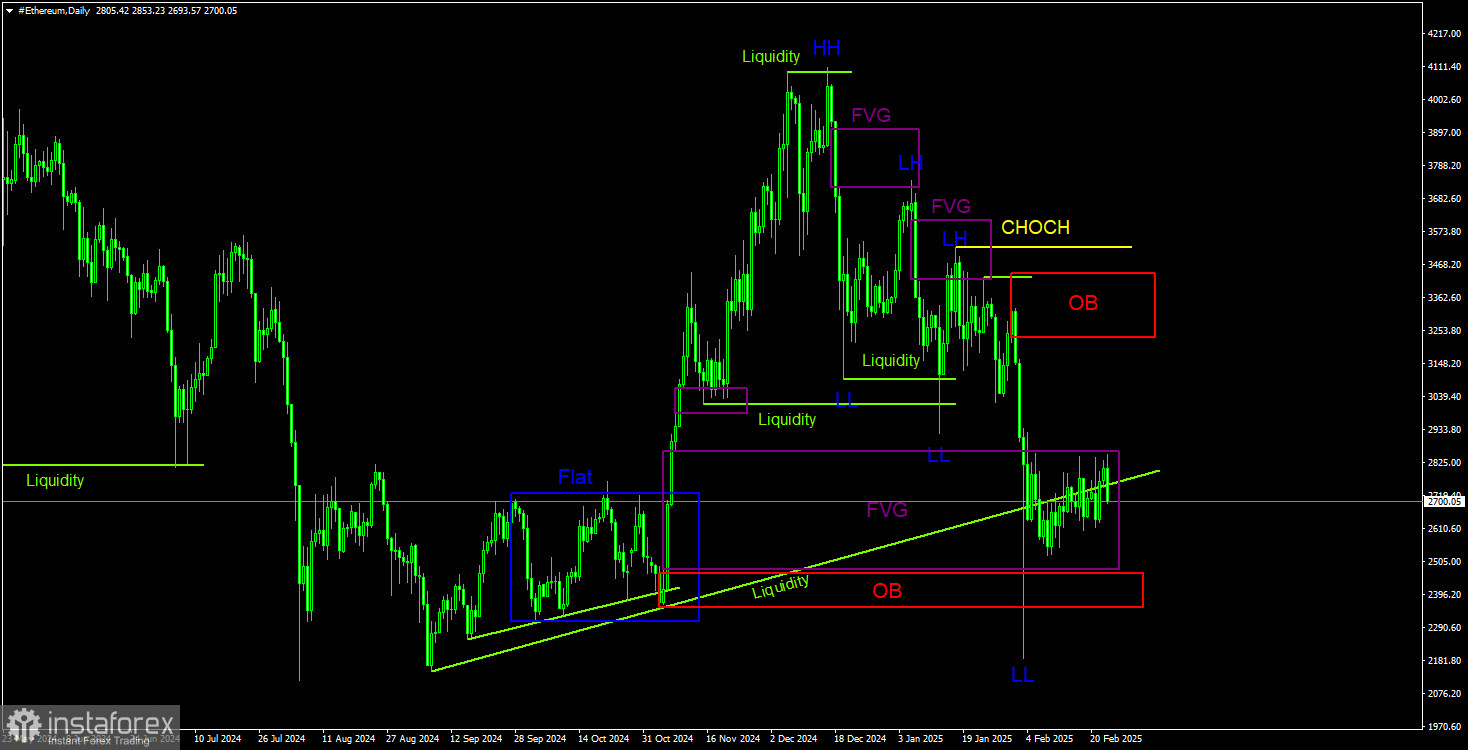
On the daily timeframe, Ethereum remains in a downtrend, while Bitcoin is still consolidating. The most recent decline was particularly strong, breaking through two key zones: the Fair Value Gap (FVG) and an Order Block (OB).
While ICT concepts work well, altcoins remain highly dependent on Bitcoin's price movements. Given the current high Bitcoin dominance, Ethereum's trend direction will continue to be dictated by BTC/USD movements.
The last structural high, marked by the CHOCH (Change of Character) level, serves as a key resistance. A breakout above this level would signal a bullish trend reversal, but given the current conditions, it is unlikely that ETH will return to $3,500 anytime soon.
Therefore, the bearish trend remains in place, although Ethereum is currently in a short-term range. If Bitcoin breaks below its consolidation range, Ethereum is expected to follow with a deeper decline.
An Order Block formed on January 31, which could act as a future resistance zone. Liquidity has already been absorbed from two major pools, marked by trendlines. These liquidity sweeps targeted stop-loss orders, suggesting that any potential upside move will be entirely dependent on Bitcoin's direction.
ETH/USD 4-Hour Chart Analysis
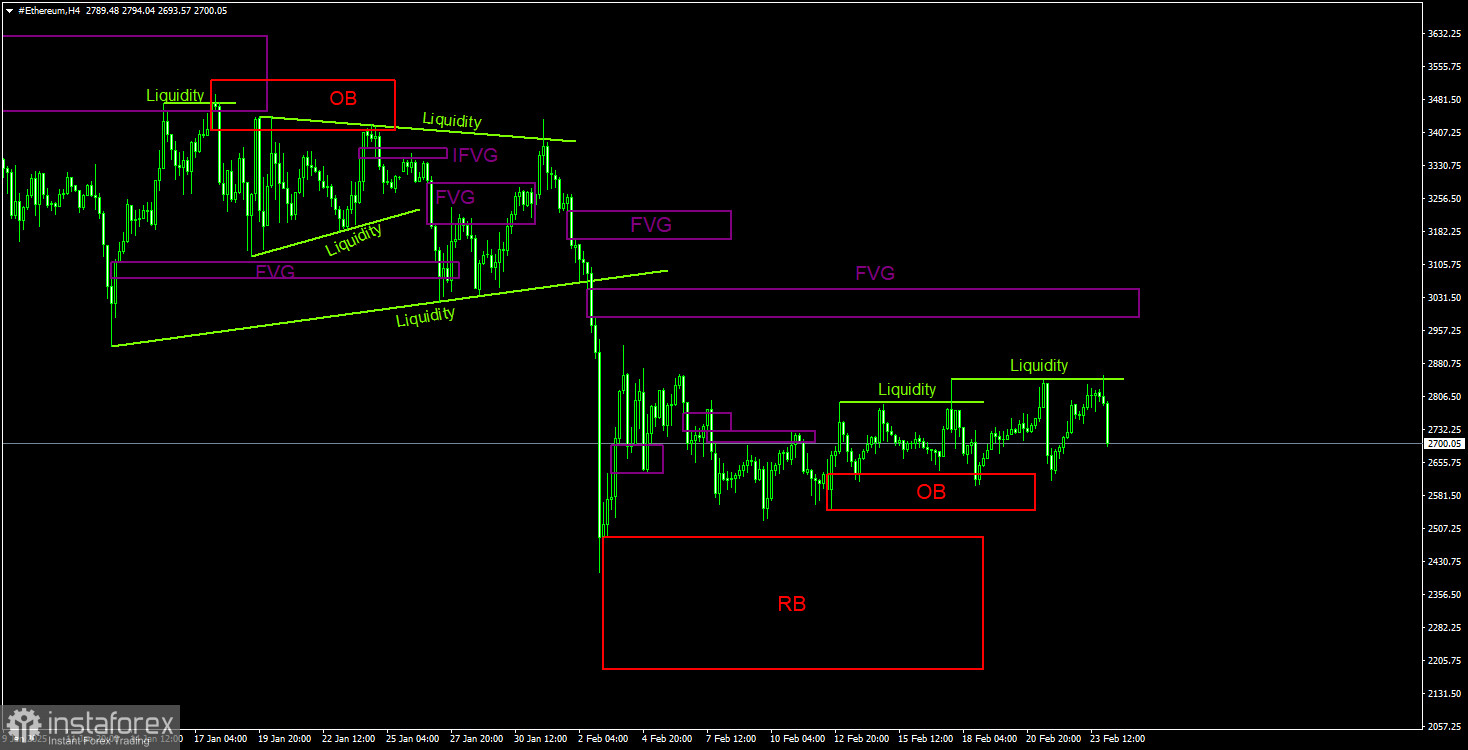
On the 4-hour timeframe, Ethereum shows no signs of a strong recovery after the recent sell-off. The next major bearish target is the Rejection Block, which is clearly marked on the chart. While Ethereum is likely to test this level, the current range-bound market could delay the move.
The most recent pattern was an Order Block (OB), which has already triggered multiple price reactions. However, given that ETH is in a tight range, each bounce from OB levels has been weak. Short-term patterns and small trades remain the only viable strategies in the current environment.
Additionally, liquidity has been swept from the last two highs, mirroring Bitcoin's movement. Given that Bitcoin has also formed similar OB structures, both cryptocurrencies appear to be setting up for a downside move.
Ethereum Trading Recommendations (ETH/USD):
Ethereum continues to exhibit bearish pressure, making short setups more favorable than long positions. So far, the altcoin market has managed to avoid a major crash due to Bitcoin's range-bound movement. However, if BTC/USD breaks below its current support levels, the entire altcoin market could experience a sharp decline.
Key Technical Terms and Explanations:
InstaForex analytical reviews will make you fully aware of market trends! Being an InstaForex client, you are provided with a large number of free services for efficient trading.


