 Stay
Stay 
Trading Conditions
Products
Tools


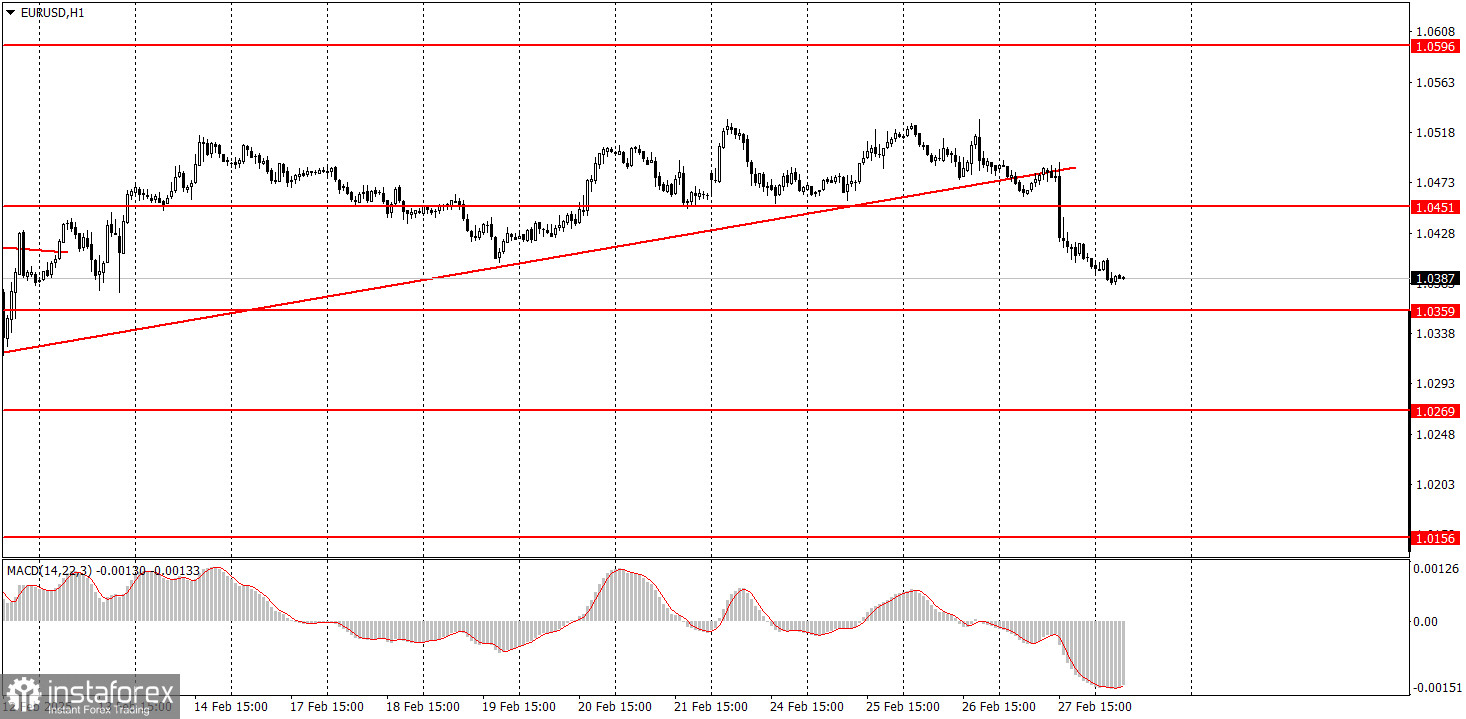
On Thursday, the EUR/USD currency pair initially consolidated below the ascending trendline before starting to decline, as anticipated. Several factors contributed to the euro's fall. Firstly, it failed to break out of the sideways range on the daily timeframe for two weeks. Secondly, there were no fundamental or macroeconomic reasons supporting its growth. Thirdly, Donald Trump announced his readiness to impose a 25% tariff on imports from the European Union. Lastly, the first U.S. economic reports of the week showed strong results. Consequently, we now expect the decline to continue within the same sideways channel on the daily timeframe. Before the correction ends, we may observe several local trends on the hourly chart; however, it is clear that the euro still lacks strong growth prospects.
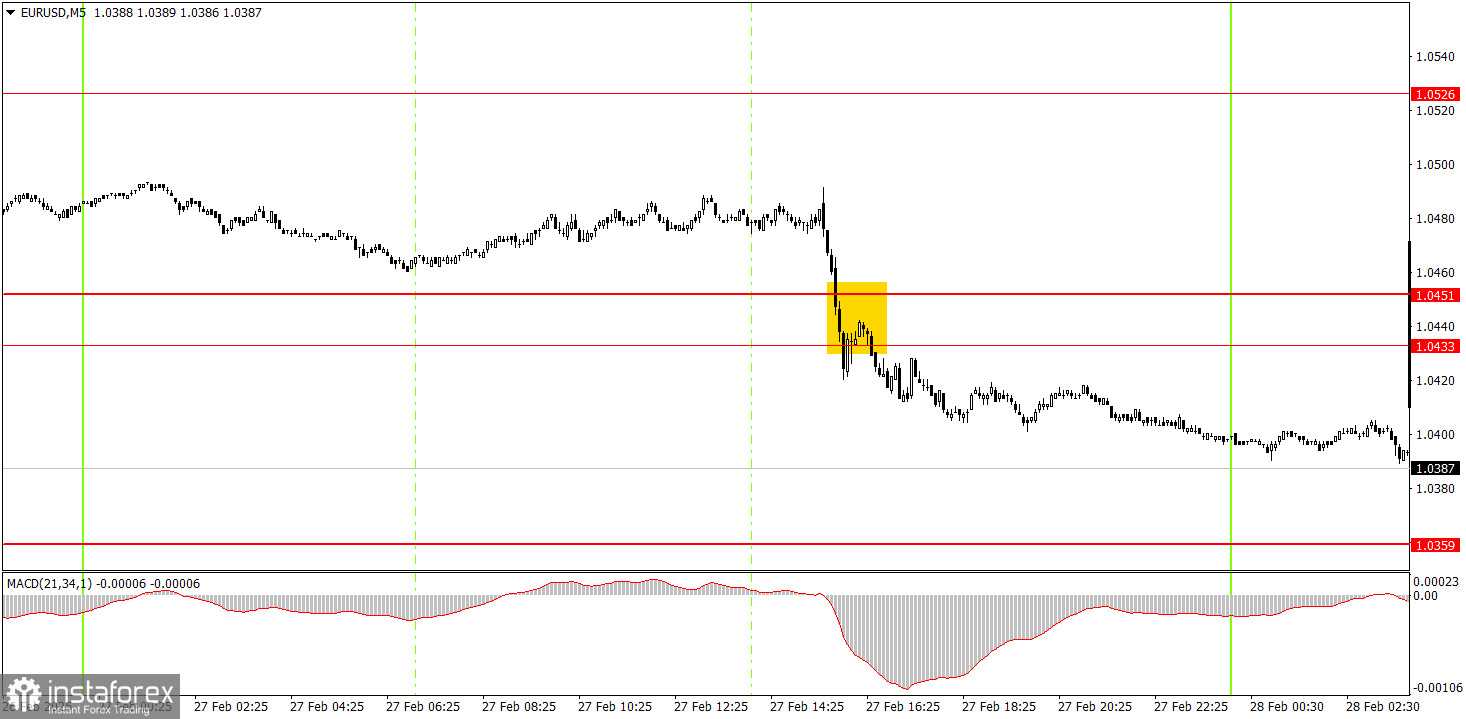
On the 5-minute chart, a trading signal emerged on Thursday. The price confidently broke through the 1.0433-1.0451 range, although this occurred not at the beginning of the movement. Therefore, novice traders who opened short positions would have made a profit, albeit not as significant as it could have been. Shorts could have been closed manually at any point or left open with a stop-loss set at breakeven. The decline is likely to continue.
In the hourly timeframe, the EUR/USD pair remains in a medium-term downtrend and a sideways range. The European currency is still expected to decline as the fundamental and macroeconomic background favors the U.S. dollar far more than the euro. We might see a few more trend fluctuations on the hourly chart before the primary downtrend resumes. However, a local decline is expected soon.
The euro's decline may continue on Friday. Macroeconomic factors could interfere with this movement, but if the drop does not occur today, it will likely happen next week.
For the 5-minute chart, the key levels to consider are 1.0156, 1.0221, 1.0269-1.0277, 1.0334-1.0359, 1.0433-1.0451, 1.0526, 1.0596, 1.0678, 1.0726-1.0733, 1.0797-1.0804, and 1.0845-1.0851. Germany will release inflation, unemployment, and retail sales reports on Friday. These are not the most critical reports but could cause a minor market reaction. In the U.S., the PCE index and data on personal income and spending will be published, which are also relatively weak reports.
Support and Resistance Levels: These are target levels for opening or closing positions and can also serve as points for placing Take Profit orders.
Red Lines: Channels or trendlines indicating the current trend and the preferred direction for trading.
MACD Indicator (14,22,3): A histogram and signal line used as a supplementary source of trading signals.
Important Events and Reports: Found in the economic calendar, these can heavily influence price movements. Exercise caution or exit the market during their release to avoid sharp reversals.
Forex trading beginners should remember that not every trade will be profitable. Developing a clear strategy and practicing proper money management are essential for long-term trading success.
InstaForex analytical reviews will make you fully aware of market trends! Being an InstaForex client, you are provided with a large number of free services for efficient trading.


