 Stay
Stay 
Trading Conditions
Products
Tools


On Tuesday, the GBP/USD pair continued its upward movement, despite the absence of any supporting factors, as neither the U.S. nor the UK released any reports throughout the day. Additionally, no major officials delivered speeches. The only significant news was Donald Trump's ongoing statements. He announced the doubling of tariffs on China, reversed his decision to grant Mexico and Canada an extra month for negotiations, and claimed that nearly every country in the world exploits the U.S. for its own gain. The market's reaction over the past two days has been noticeable—the British pound is rising. However, it is not so much the pound that is gaining value, but rather the dollar that is facing severe pressure. Current macroeconomic and technical factors seem almost irrelevant; the market is simply fleeing from the dollar in a panic.
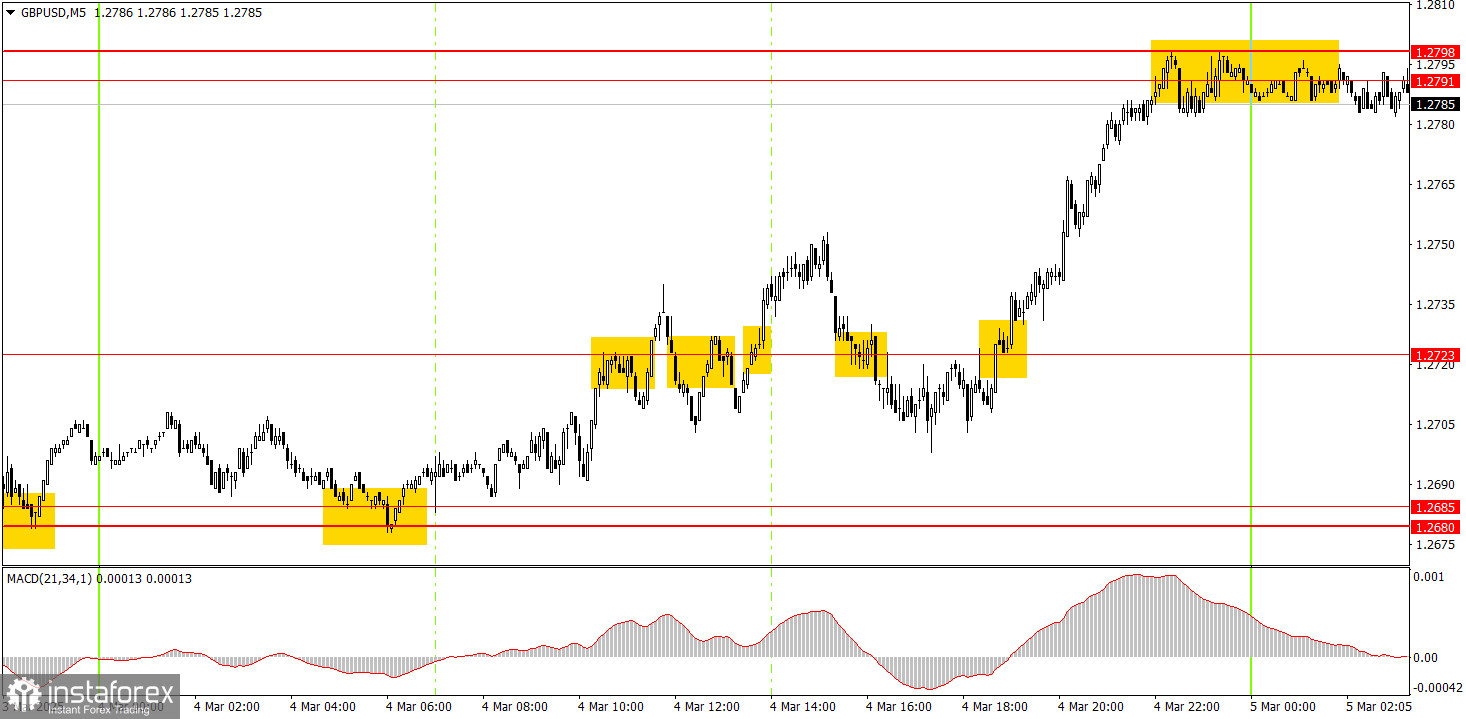
On the 5-minute timeframe, numerous trading signals emerged on Tuesday. Although the price generally moved in one direction throughout the day, the quality of the signals still stands out. The price is ignoring established levels, fluctuating wildly, and not responding to macroeconomic data—or its absence. The movements appear illogical and challenging to predict. The dollar may continue to decline each day largely due to Trump's policies.
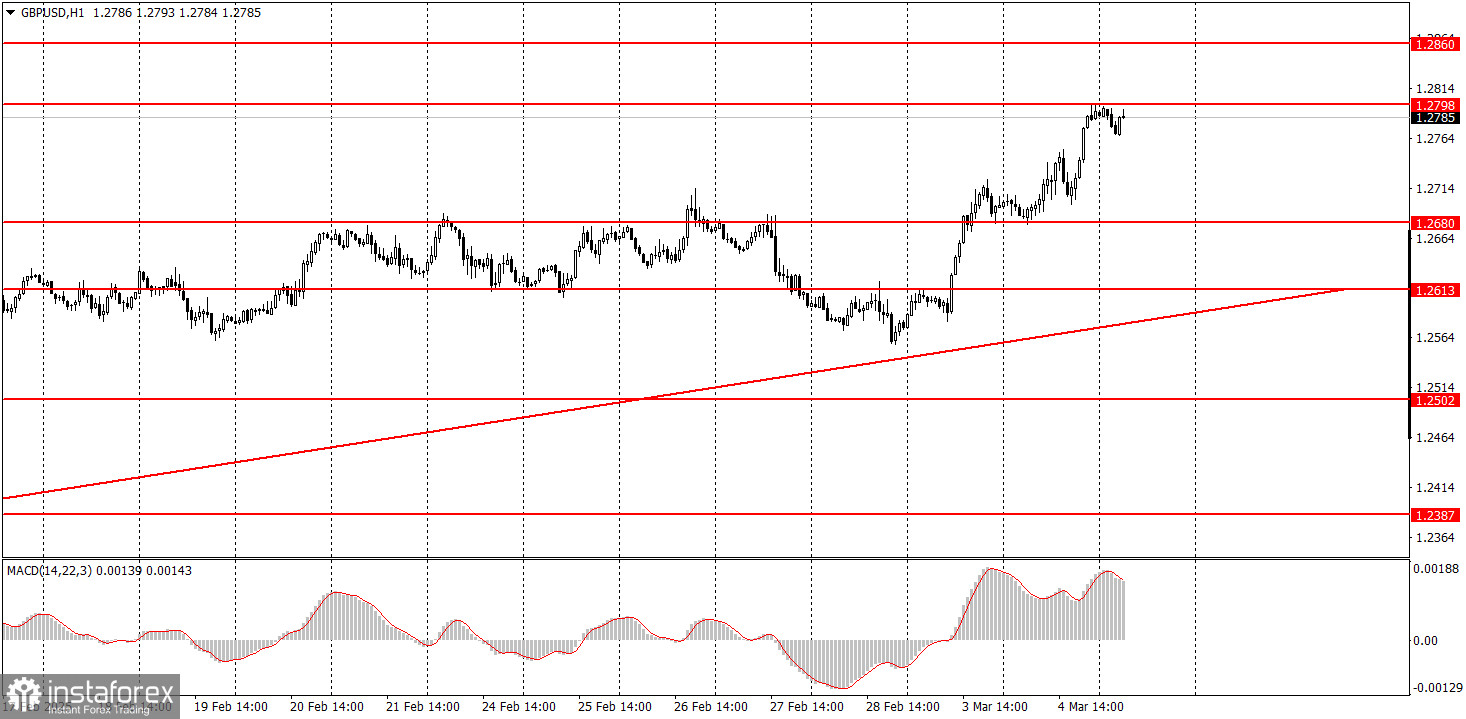
The GBP/USD pair might start a short-term downward trend in the hourly timeframe, but Trump is doing everything possible to prevent this. In the medium term, we still expect the pound to decline toward 1.1800, considering this the most logical outcome. However, traders should wait for the current upward correction on the daily timeframe to end and for the price to consolidate below the trendline on the hourly chart. Ideally, this should happen once Trump stops imposing sanctions on every country.
On Wednesday, GBP/USD could continue to rise if Trump continues to stir chaos and dictate terms to the world. Trading from levels is possible, but they are often ignored.
On the 5-minute timeframe, key trading levels are 1.2164-1.2170, 1.2241-1.2270, 1.2301, 1.2372-1.2387, 1.2445, 1.2502-1.2508, 1.2547, 1.2613, 1.2680-1.2685, 1.2723, and 1.2791-1.2798. On Wednesday, service sector PMIs will be released in the UK and the U.S. Additionally, the U.S. ADP labor market report will be published. These data points are quite important, but the market is currently focused solely on selling the dollar.
Support and Resistance Levels: These are target levels for opening or closing positions and can also serve as points for placing Take Profit orders.
Red Lines: Channels or trendlines indicating the current trend and the preferred direction for trading.
MACD Indicator (14,22,3): A histogram and signal line used as a supplementary source of trading signals.
Important Events and Reports: Found in the economic calendar, these can heavily influence price movements. Exercise caution or exit the market during their release to avoid sharp reversals.
Forex trading beginners should remember that not every trade will be profitable. Developing a clear strategy and practicing proper money management are essential for long-term trading success.
InstaForex analytical reviews will make you fully aware of market trends! Being an InstaForex client, you are provided with a large number of free services for efficient trading.


