 Stay
Stay 
Trading Conditions
Products
Tools


The GBP/USD pair also came to a halt on Thursday. There were no fundamental or macroeconomic reasons for the British pound or the US dollar to rise or fall, as the economic background was weak, and fundamental factors were absent. Additionally, Donald Trump took a day off, refraining from introducing new tariffs. As a result, the market took a well-deserved break.
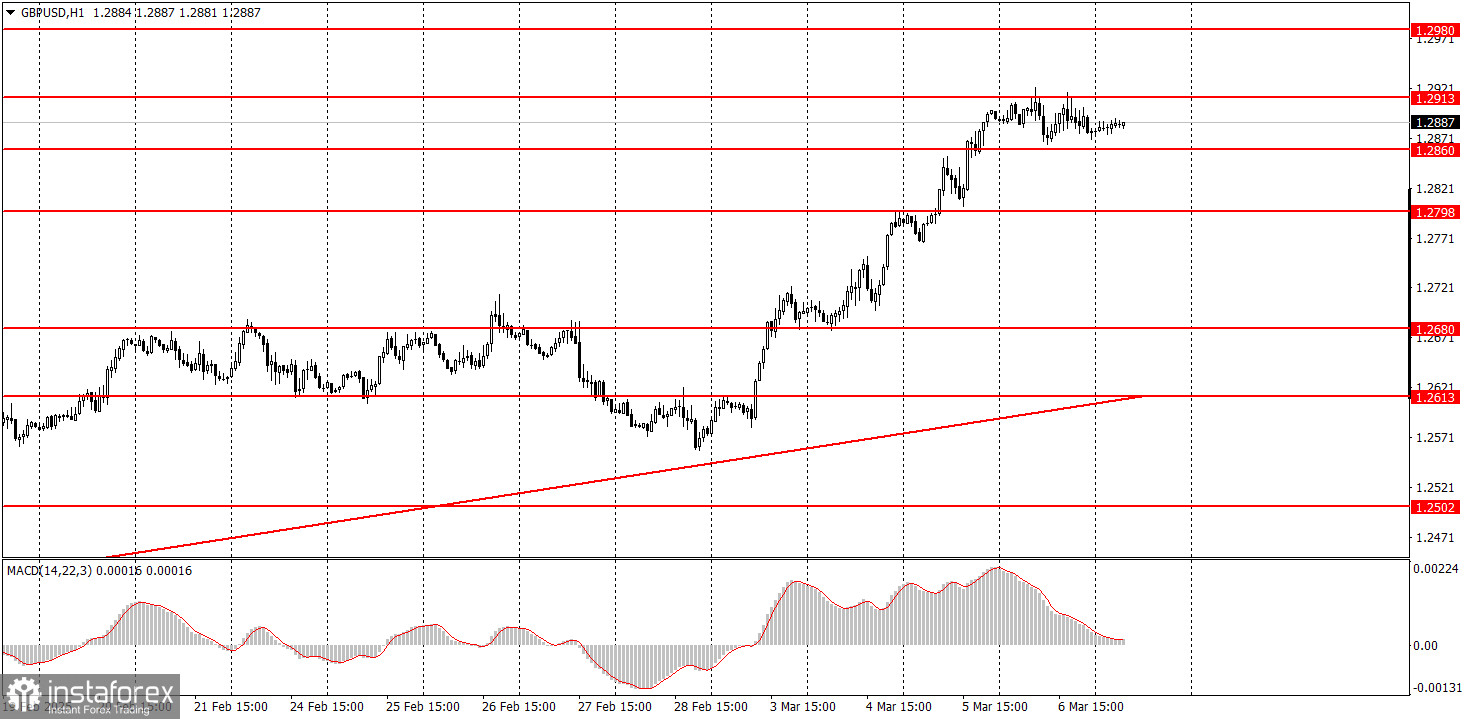
Overall, the uptrend on the hourly time frame remains intact. It should have ended a week ago, but Trump's actions completely disrupted the technical outlook. The market spent three consecutive days aggressively selling the US dollar. If today's macroeconomic statistics from the US turn out weak, the dollar may continue its decline. However, as we have mentioned before, there is little logic in the current price movements, so it would not be surprising if the data disappoints, yet the dollar starts rising instead.
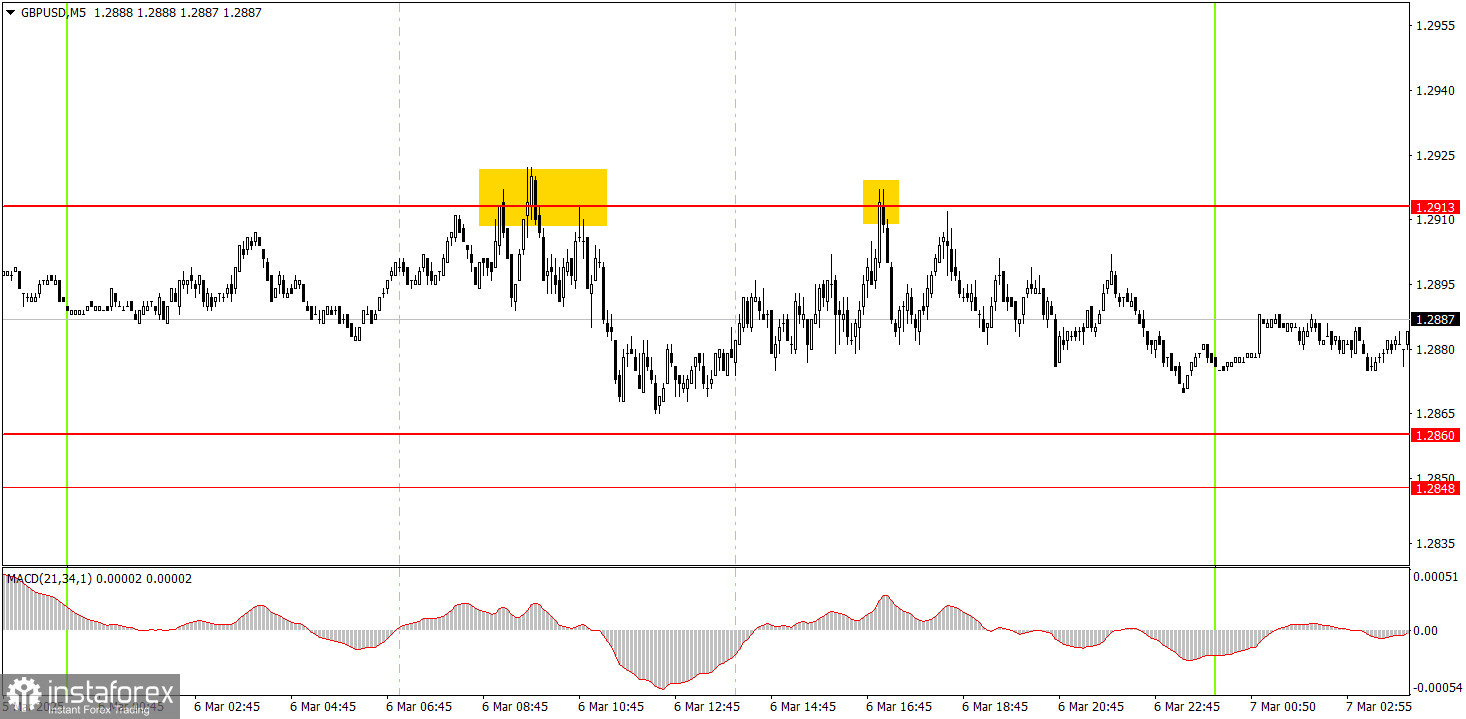
On the 5-minute chart, several trading signals were formed near 1.2913, but the price traded sideways throughout the day. In both cases, beginner traders could have opened short positions, but the nearest target level was never reached. Still, these signals allowed for some small profit opportunities.
In the hourly time frame, GBP/USD may start a short-term downtrend, but Trump is doing everything to prevent this from happening. In the medium term, we still expect a decline towards 1.1800, as we believe this is the most logical scenario. However, the correction on the daily time frame must first be completed, with the price securing itself below the trendline on the hourly chart. It would also help if Trump stopped imposing sanctions on everyone.
On Friday, GBP/USD could continue rising, especially if Donald Trump continues to stir up global uncertainty and dictate his policies. Additionally, several major events today could trigger another sharp dollar sell-off.
On the 5-minute chart, the current trading levels are 1.2164-1.2170, 1.2241-1.2270, 1.2301, 1.2372-1.2387, 1.2445, 1.2502-1.2508, 1.2547, 1.2613, 1.2680-1.2685, 1.2723, 1.2791-1.2798.
There are no significant events scheduled for the UK on Friday. However, in the US, we will have a speech from Jerome Powell, who may comment on Trump's economic measures. Additionally, Non-Farm Payrolls (NFP) and unemployment rate data will be published. These three events could trigger a strong market reaction.
Key Rules of the Trading System
Chart Explanations
Support and resistance levels – These are targets for opening buy or sell positions. Take Profit orders can be placed near these levels.
Red lines – Trend channels or trendlines that indicate the current market direction and the preferred direction for trading.
MACD indicator (14,22,3) – Histogram and signal line – a secondary indicator that can also be used for trade signals.
Major news events and speeches (always included in the economic calendar) can heavily influence currency movements. Therefore, during major news releases, trading should be done with extreme caution, or traders should exit the market to avoid sharp price reversals.
Every trade cannot be profitable. Developing a clear trading strategy and applying sound money management are the keys to long-term success in forex trading.
InstaForex analytical reviews will make you fully aware of market trends! Being an InstaForex client, you are provided with a large number of free services for efficient trading.


