This information is provided to retail and professional clients as part of marketing communication. It does not contain and should not be construed as containing investment advice or investment recommendation or an offer or solicitation to engage in any transaction or strategy in financial instruments. Past performance is not a guarantee or prediction of future performance. Instant Trading EU Ltd. makes no representation and assumes no liability as to the accuracy or completeness of the information provided, or any loss arising from any investment based on analysis, forecast or other information provided by an employee of the Company or otherwise. Full disclaimer is available here.
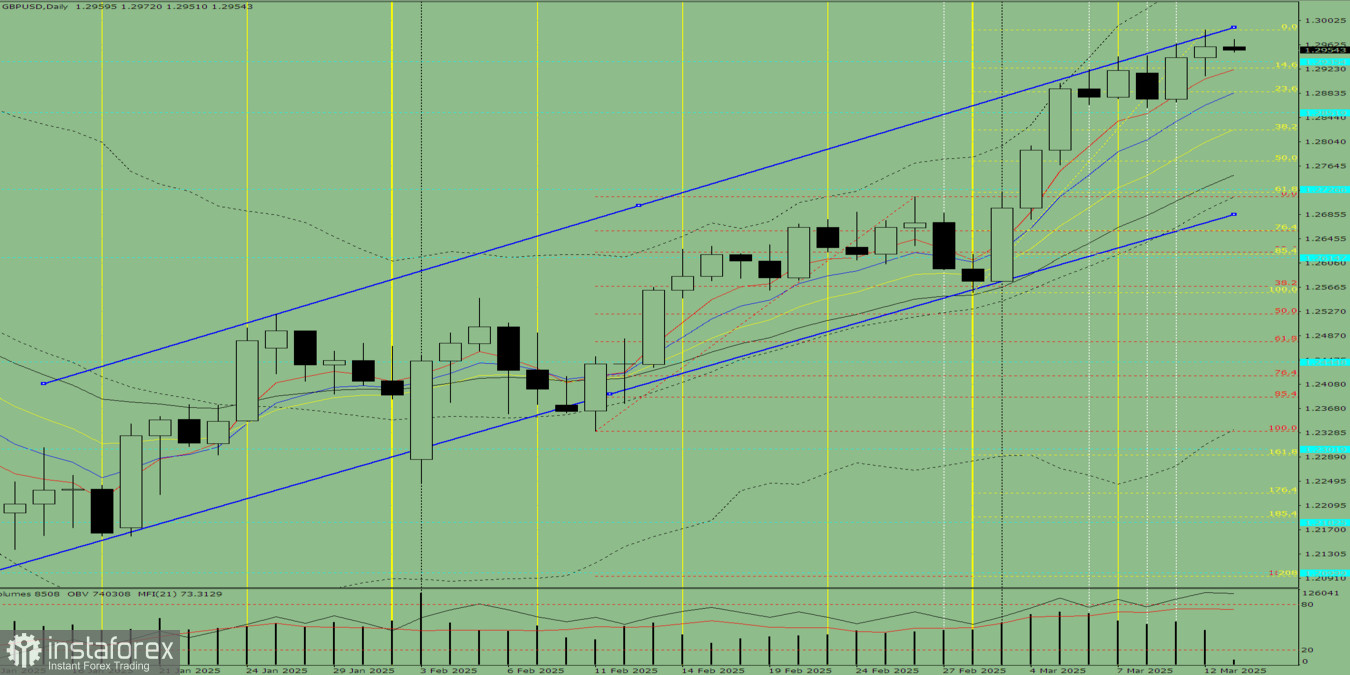
Trend Analysis (Fig. 1):
On Thursday, the market may start moving downward from the 1.2959 level (yesterday's daily close) toward 1.2924 – the 14.6% retracement level (yellow dashed line). From this level, the price might rebound upwards toward 1.2988 – the upper fractal (blue dashed line).
Fig. 1 (Daily Chart)
Comprehensive Analysis:
- Indicator Analysis: Bearish
- Fibonacci Levels: Bearish
- Volume Analysis: Bearish
- Candlestick Analysis: Bearish
- Trend Analysis: Bullish
- Bollinger Bands: Bullish
- Weekly Chart: Bearish
Overall Conclusion: Bearish trend.
Alternative Scenario:
The price could start moving downward from 1.2959 (yesterday's daily close) toward 1.2886 – the 23.6% retracement level (yellow dashed line). From this level, a potential upward correction to 1.2988 – the upper fractal (blue dashed line) may occur.
InstaForex analytical reviews will make you fully aware of market trends! Being an InstaForex client, you are provided with a large number of free services for efficient trading.
 Stay
Stay