 Stay
Stay 
Trading Conditions
Products
Tools


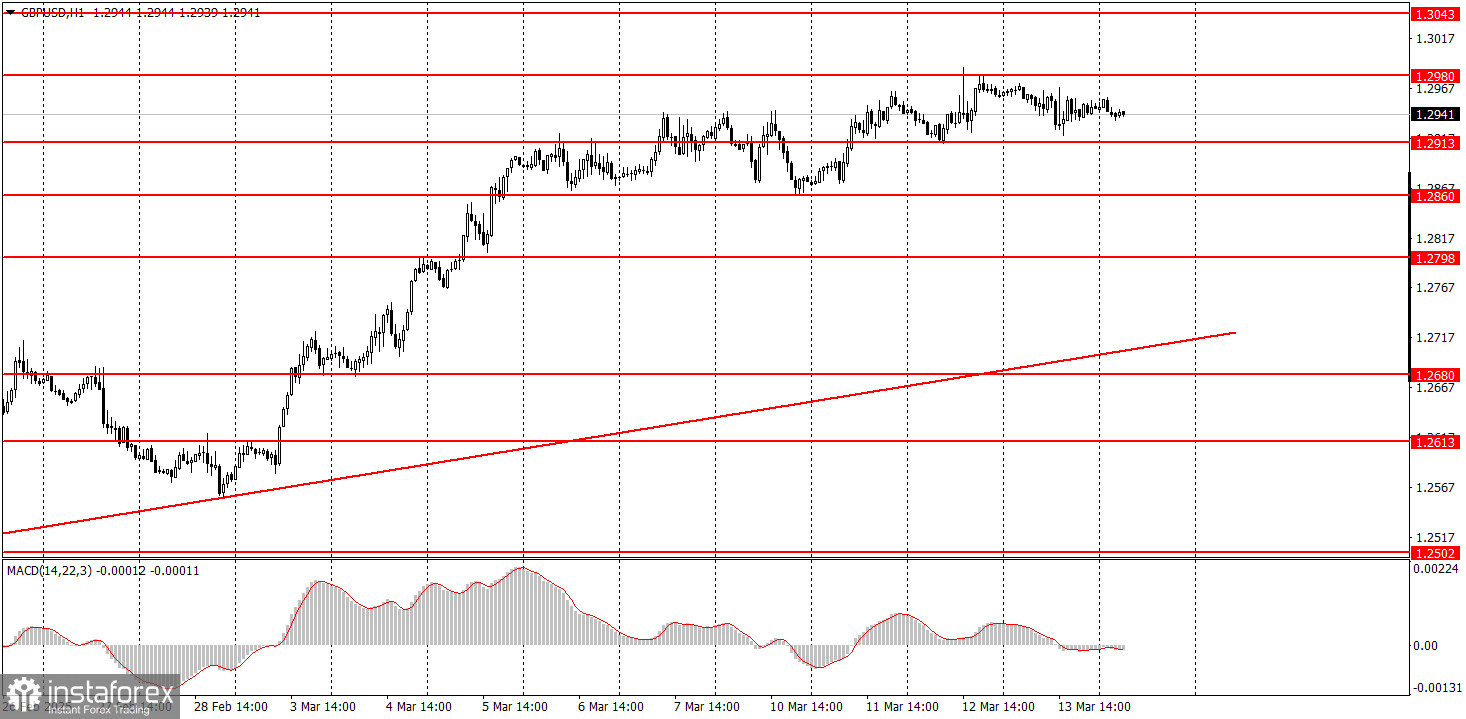
On Thursday, the GBP/USD pair experienced a slight decline but remained within a very narrow range, resembling a sideways channel. The British pound has been fluctuating between the 1.2913 and 1.2980 levels for several days. Despite a significant rally, a correction has yet to start, indicating that the market is not currently focused on purchasing dollars or taking profits on long positions. Most of the macroeconomic and fundamental factors are being overlooked, making movements difficult to predict. It is uncertain when Trump will announce new tariffs, which could potentially trigger another decline in the dollar. Additionally, it remains unknown when the market will shift its focus from this singular factor and start considering other influences. The uptrend remains intact, as the trendline is still valid.
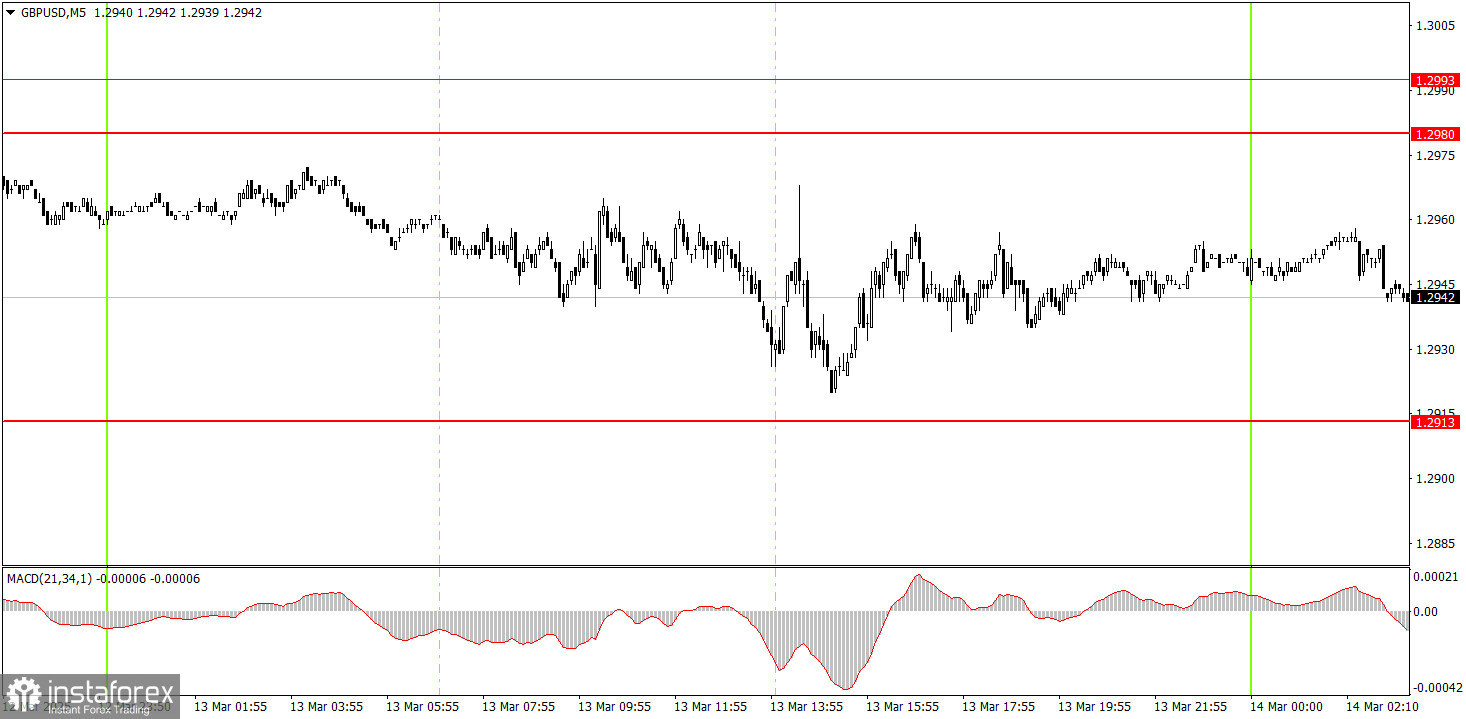
On the 5-minute timeframe, no trading signals were generated on Thursday. Throughout the day, the price did not approach the boundaries of the sideways channel, indicating there was no justification for entering the market.
On the hourly timeframe, the GBP/USD pair should have started a downtrend long ago, but Trump continues to prevent this from happening. We still expect a pound decline toward 1.1800 in the medium term, but it is unclear how long the Trump-induced dollar decline will persist. Once this movement ends, the technical picture across all timeframes could change drastically. For now, however, long-term trends still point downward. While the British pound's rise is not without reason, it has been excessive and irrational.
On Friday, GBP/USD may continue rising if Trump continues to stir up chaos and dictate global conditions. A downward correction is overdue, but the market focuses only on selling the dollar. The inertia-driven move north may well continue.
On the 5-minute timeframe, consider trading at the following levels: 1.2301, 1.2372–1.2387, 1.2445, 1.2502–1.2508, 1.2547, 1.2613, 1.2680–1.2685, 1.2723, 1.2791–1.2798, 1.2848–1.2860, 1.2913, 1.2980–1.2993, 1.3043, 1.3102–1.3107. On Friday, the UK will release January's GDP and industrial production reports. These are relatively important but not critical reports and are unlikely to cause a significant decline in the pound. In the U.S., the University of Michigan Consumer Sentiment Index will be published.
Support and Resistance Levels: These are target levels for opening or closing positions and can also serve as points for placing Take Profit orders.
Red Lines: Channels or trendlines indicating the current trend and the preferred direction for trading.
MACD Indicator (14,22,3): A histogram and signal line used as a supplementary source of trading signals.
Important Events and Reports: Found in the economic calendar, these can heavily influence price movements. Exercise caution or exit the market during their release to avoid sharp reversals.
Forex trading beginners should remember that not every trade will be profitable. Developing a clear strategy and practicing proper money management are essential for long-term trading success.
InstaForex analytical reviews will make you fully aware of market trends! Being an InstaForex client, you are provided with a large number of free services for efficient trading.


