 Stay
Stay 
Trading Conditions
Products
Tools


The GBP/USD currency pair experienced a slight decline on Friday, with minimal volatility. In fact, the British currency has been falling for three consecutive days, losing a total of 50 pips during this time. In the hourly time frame, the price has not been able to consolidate below the critical line yet. After a period of strong growth, there are currently no signs indicating the start of a correction. While Friday's UK GDP report and UK industrial production report were disappointing, the consumer sentiment index from the University of Michigan in the U.S. also fell short of expectations. However, during the European trading session, the British pound had valid reasons to decline, yet, as mentioned, macroeconomic reports seem to hold little significance for market participants right now. With Donald Trump "on vacation," traders appear reluctant to engage in trading.
In the hourly time frame, the technical picture indicates both signs of an upward trend and a flat market. Although the pair continues to experience growth, it has been trading sideways for the past week. Low volatility adds to the challenges faced by traders. If the pair consolidates below the critical line, it may prompt a drop to the level of 1.2863. However, it's clear that the market is not eager to sell the pound or buy the dollar. A rebound from the Kijun-sen line could trigger new growth, but this would likely require new tariffs from Donald Trump.
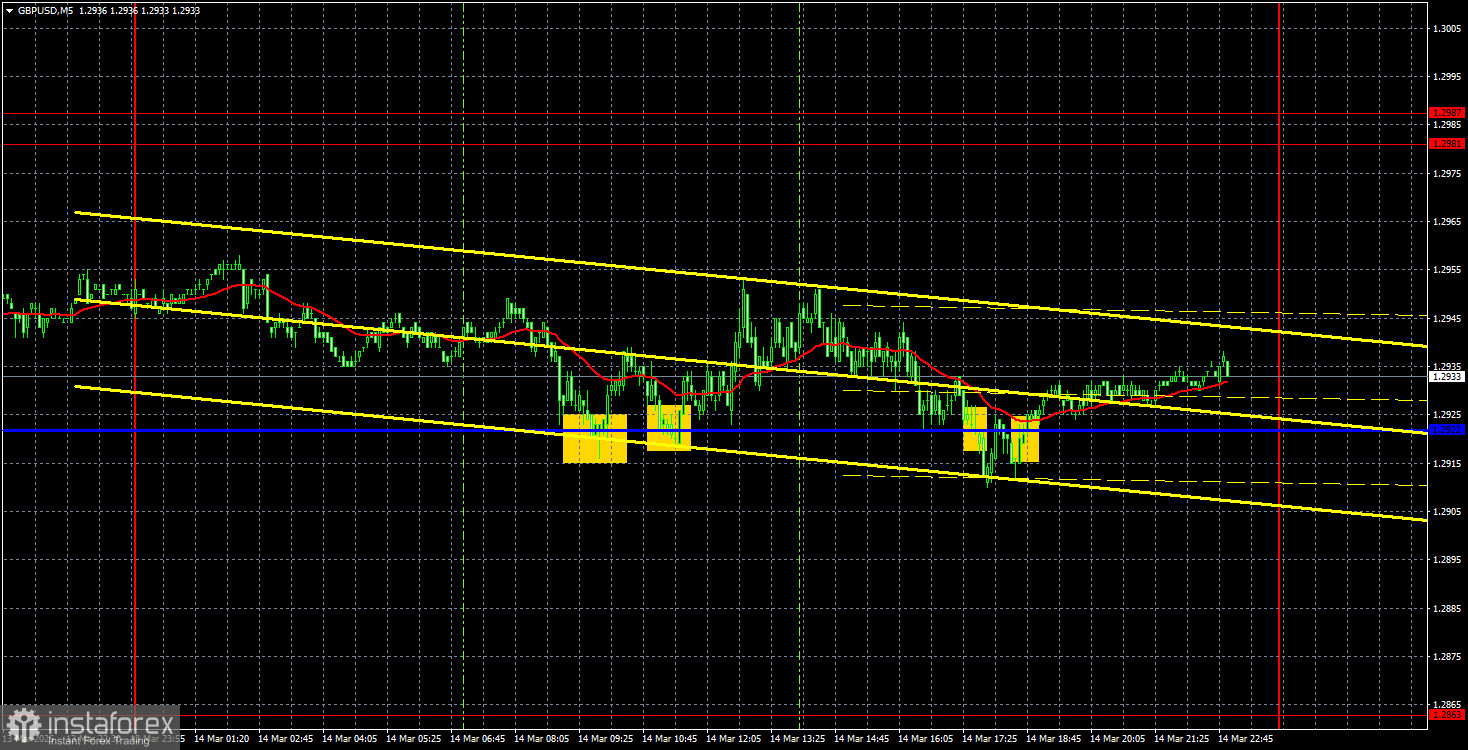
On the 5-minute time frame on Friday, the price rebounded from the Kijun-sen line twice, leading to rises of 10 and 20 pips, respectively. Therefore, there was little value in acting on the last two signals near the same critical line.
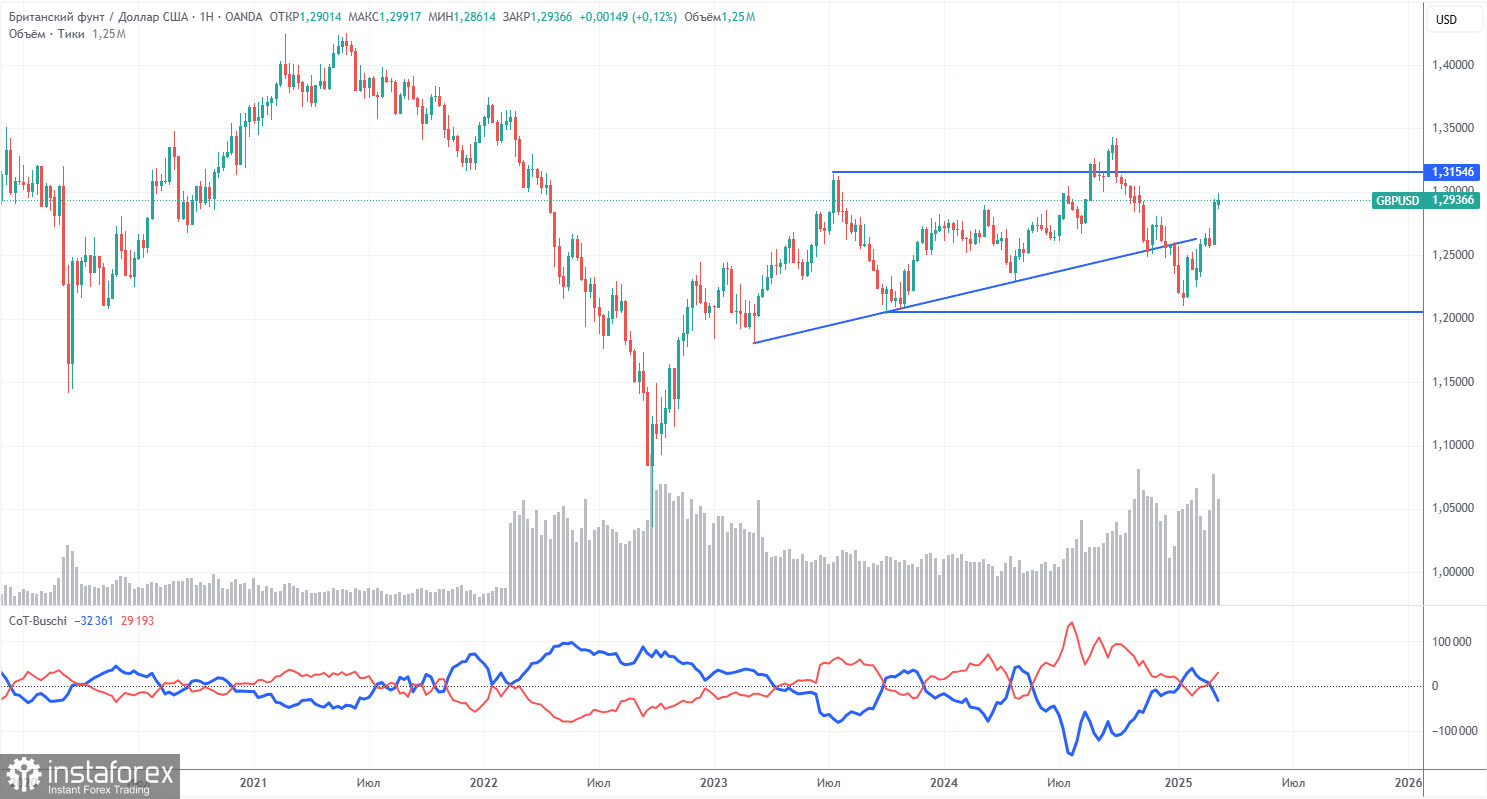
The COT reports for the British pound indicate that the sentiment among commercial traders has been consistently changing over the years. The red and blue lines, which represent the net positions of commercial and non-commercial traders, frequently intersect and are often close to zero. Currently, these lines are positioned near each other, suggesting there is an approximately equal number of buy and sell positions.
In the weekly time frame, the price initially broke through the level of 1.3154 before declining to the trend line, which it successfully surpassed. This break of the trend line suggests a high probability of a continued decline in the pound. However, it's worth noting the rebound from the penultimate local minimum on the weekly time frame, indicating that we may be experiencing a sideways market (or flat).
According to the latest report on the British pound, the non-commercial group opened 12,900 BUY contracts and 2,300 SELL contracts. Consequently, the net position of non-commercial traders increased by 10,600 contracts over the week.
The fundamental factors do not currently support any long-term purchases of the pound sterling, and the currency is likely to continue its global downward trend. Although the pound has seen significant growth recently, it is crucial to recognize that this increase can be largely attributed to Trump's policies.
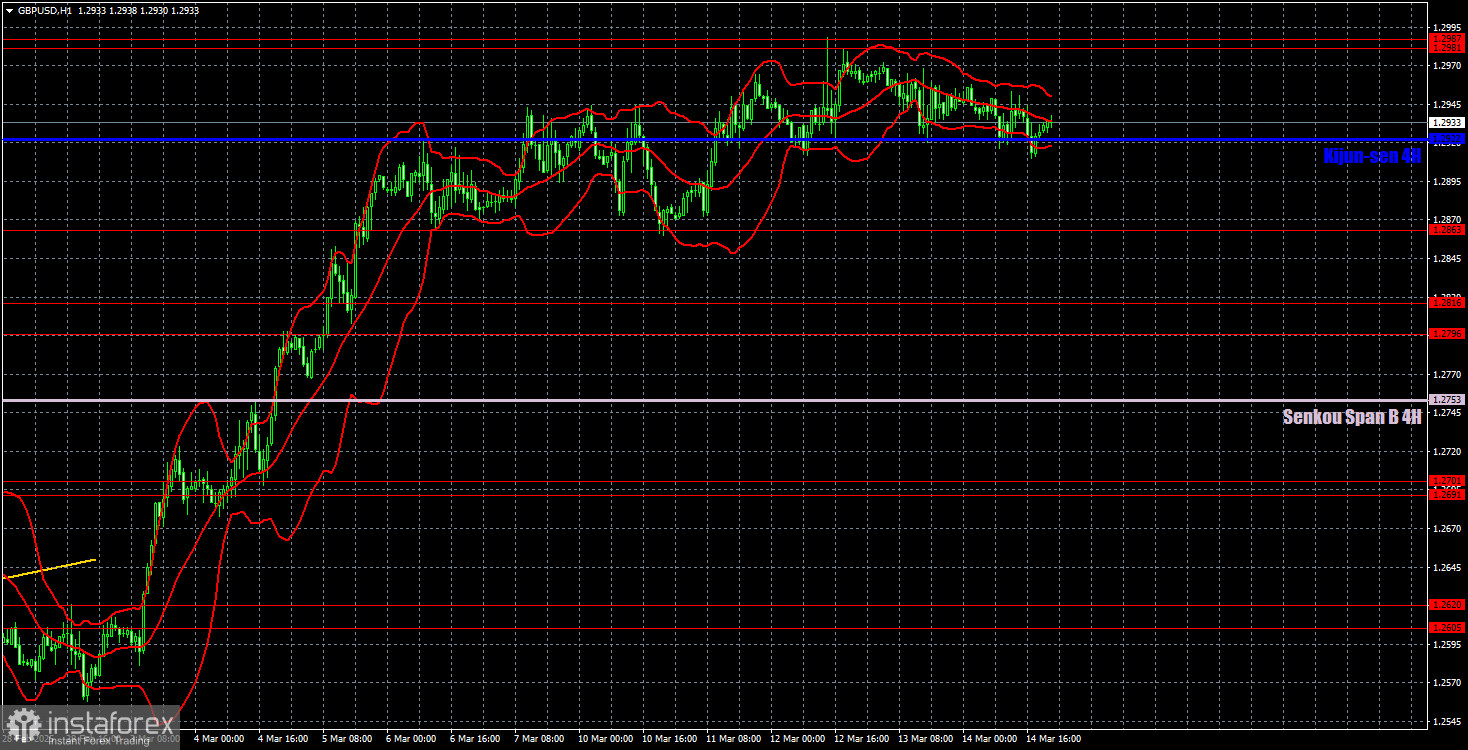
On the hourly timeframe, the GBP/USD pair is currently in an upward trend, but it has entered a flat phase. While this might not be the last shift in a series of changing trends within the broader upward correction observed on the daily timeframe, it is clear that this correction is overdue for completion. From a long-term perspective, there appears to be little reason for the British pound to exhibit growth. The only significant factor currently benefiting the pound is the influence of Donald Trump, who is imposing sanctions and tariffs consistently. Other market factors are largely being overlooked.
On March 17, we identified several important levels: 1.2237-1.2255, 1.2331-1.2349, 1.2429-1.2445, 1.2511, 1.2605-1.2620, 1.2691-1.2701, 1.2796-1.2816, 1.2863, 1.2981-1.2987, and 1.3050. The Senkou Span B (1.2753) and Kijun-sen (1.2922) lines may also provide trading signals. It is advisable to set a Stop Loss level at breakeven once the price moves 20 pips in the desired direction. Traders should also consider that the Ichimoku indicator lines may fluctuate throughout the day, impacting the determination of trading signals.
There are no significant events scheduled in the UK for Monday, but a retail sales report is expected in the US. Later in the week, the Bank of England and the Federal Reserve will hold meetings, which should create some volatility in the markets. However, it's important to remember that Trump's actions are currently the primary drivers of the forex market.
InstaForex analytical reviews will make you fully aware of market trends! Being an InstaForex client, you are provided with a large number of free services for efficient trading.


