 Stay
Stay 
Trading Conditions
Products
Tools


On Tuesday, the EUR/USD currency pair showed an inclination to rise again. A closer examination of intraday movements reveals that the pair initially increased, then decreased, and subsequently rose again. Two out of these three movements aligned with the macroeconomic context, as the ZEW indices for the Eurozone and Germany exceeded expectations, alongside stronger-than-anticipated U.S. data. However, the final upward movement was not supported by these macroeconomic factors, highlighting a key issue with the current price action. The market seems to either completely disregard incoming data and sell the dollar or react to reports and then sell the dollar again. As a result, the current price movement cannot be considered logical.
However, this does not mean that trading is impossible at the moment. It is essential to understand the nature of the current movement. The uptrend remains intact on the hourly timeframe, but the dollar continues to weaken, primarily due to Donald Trump's policies.
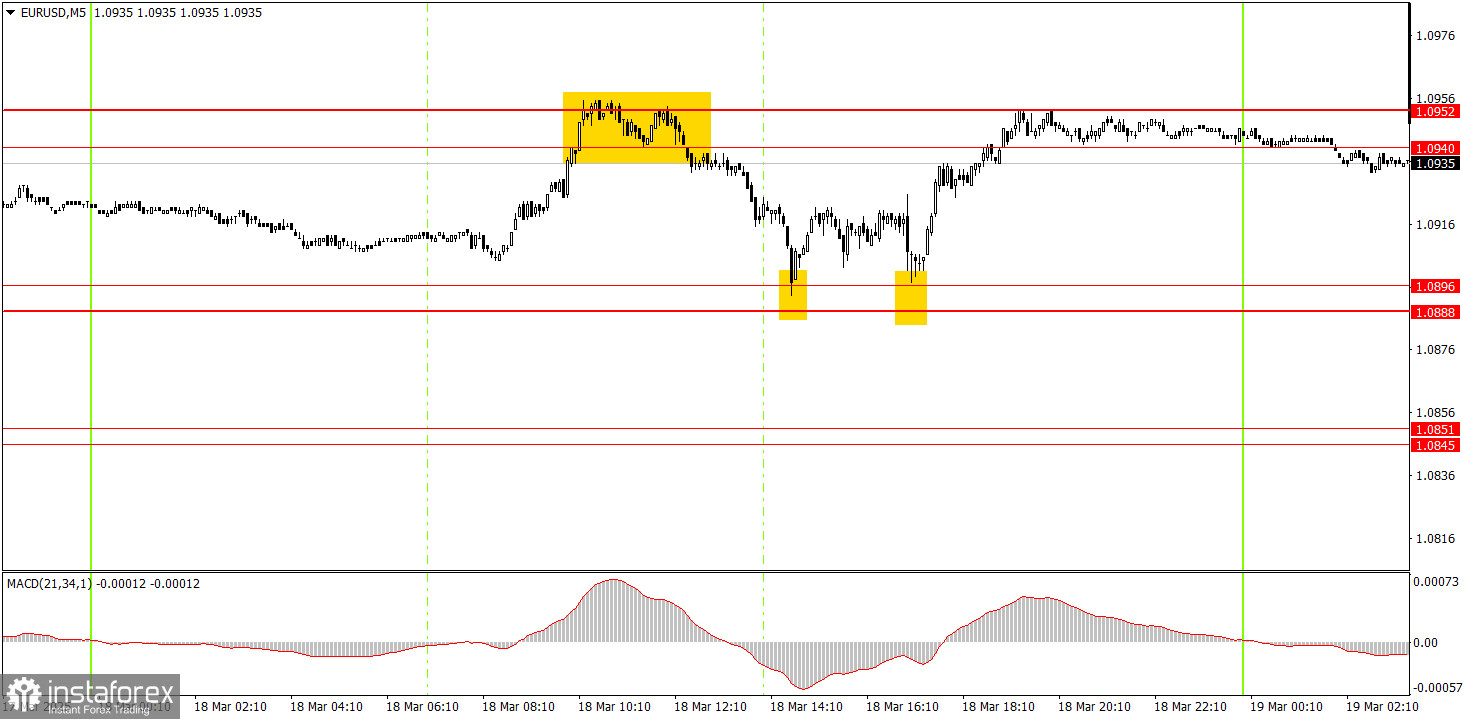
On the 5-minute timeframe, three trade signals were generated on Tuesday. First, the pair bounced off the 1.0940-1.0952 range and reached the nearest target at 1.0896, making this trade profitable. Following that, two more bounces occurred in the 1.0888-1.0896 area, and by the evening, the price had returned to the 1.0940-1.0952 range. Thus, novice traders could have opened two trades, each yielding approximately 25 pips in profit.
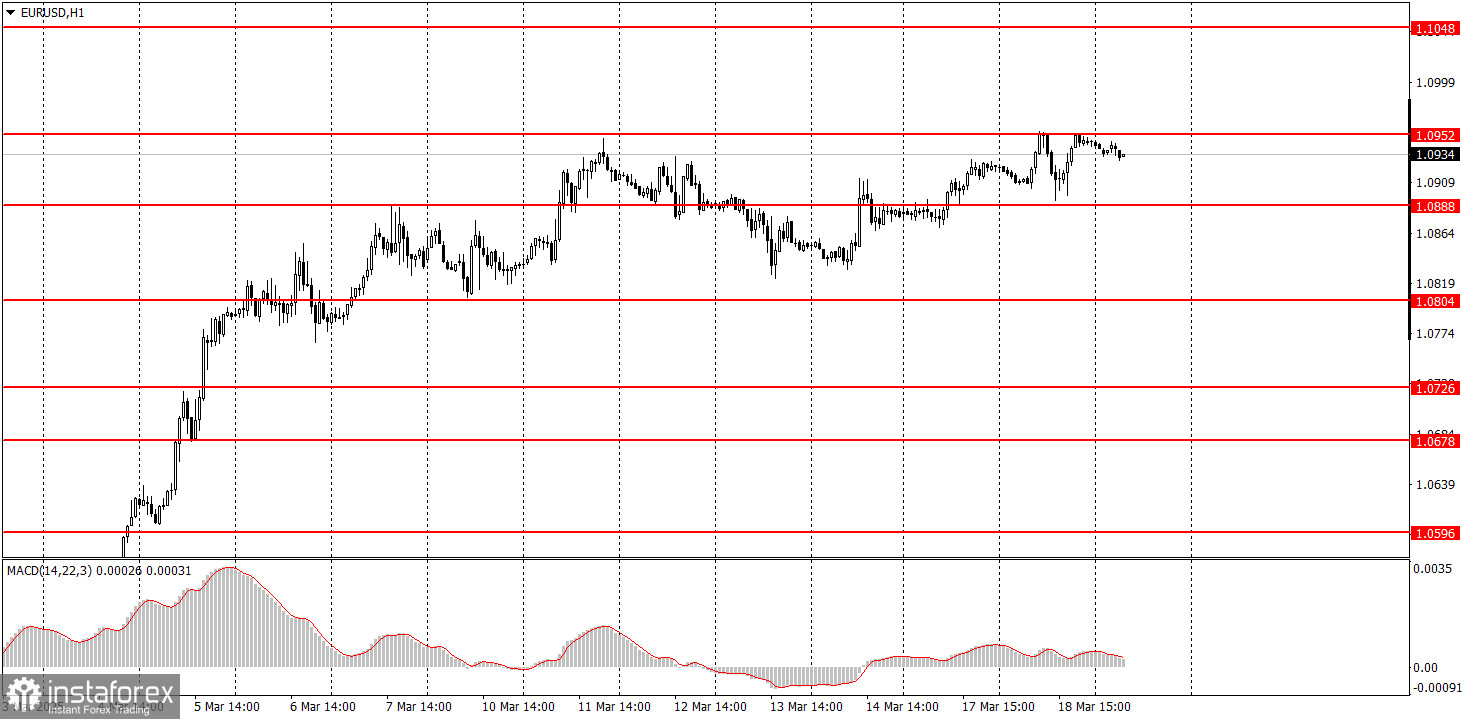
On the hourly timeframe, the EUR/USD pair remains in a medium-term downtrend, but the chances of a continuation are diminishing. Since the fundamental and macroeconomic backdrop still favors the U.S. dollar more than the euro, we continue to expect a decline. However, Donald Trump continues to push the dollar lower with his tariff decisions and statements about U.S. global policy. Fundamentals and macroeconomics remain overshadowed by politics and geopolitics, leading to a constant decline in the dollar.
On Wednesday, the euro may move in any direction, as macroeconomic and fundamental factors currently do not consistently impact the pair. Thus, trading from the 1.0940-1.0952 area remains relevant.
On the 5-minute timeframe, key levels to watch are 1.0433-1.0451, 1.0526, 1.0596, 1.0678, 1.0726-1.0733, 1.0797-1.0804, 1.0845-1.0851, 1.0888-1.0896, 1.0940-1.0952, 1.1011, and 1.1048. On Wednesday, the second estimate of February inflation will be released in the Eurozone, but it is unlikely to trigger a market reaction. However, the Federal Reserve meeting, Powell's speech, and the "dot plot" chart could cause market turbulence in the evening.
Support and Resistance Levels: These are target levels for opening or closing positions and can also serve as points for placing Take Profit orders.
Red Lines: Channels or trendlines indicating the current trend and the preferred direction for trading.
MACD Indicator (14,22,3): A histogram and signal line used as a supplementary source of trading signals.
Important Events and Reports: Found in the economic calendar, these can heavily influence price movements. Exercise caution or exit the market during their release to avoid sharp reversals.
Forex trading beginners should remember that not every trade will be profitable. Developing a clear strategy and practicing proper money management are essential for long-term trading success.
InstaForex analytical reviews will make you fully aware of market trends! Being an InstaForex client, you are provided with a large number of free services for efficient trading.


