 Stay
Stay 
Trading Conditions
Products
Tools


On Tuesday, the EUR/USD currency pair continued to trade within a sideways channel, which is now visible on virtually any timeframe and easily recognized even at a glance. As a reminder, at the beginning of last week, the price briefly exited this range — as usual, due to Donald Trump. The U.S. president first decided to fire Federal Reserve Chair Jerome Powell, then changed his mind the next day. We believe such news carried no real significance, as Trump has no direct power over the Fed. Nevertheless, the market reacted to both events, which led to the breakout and the subsequent return to the channel. Excluding those moves, the pair has been in a flat range for three weeks now. Nothing changed yesterday, and traders once again ignored the macroeconomic background. The only somewhat meaningful report — U.S. JOLTS job openings — came in weaker than expected, which wasn't surprising. However, the dollar showed no significant decline in response.
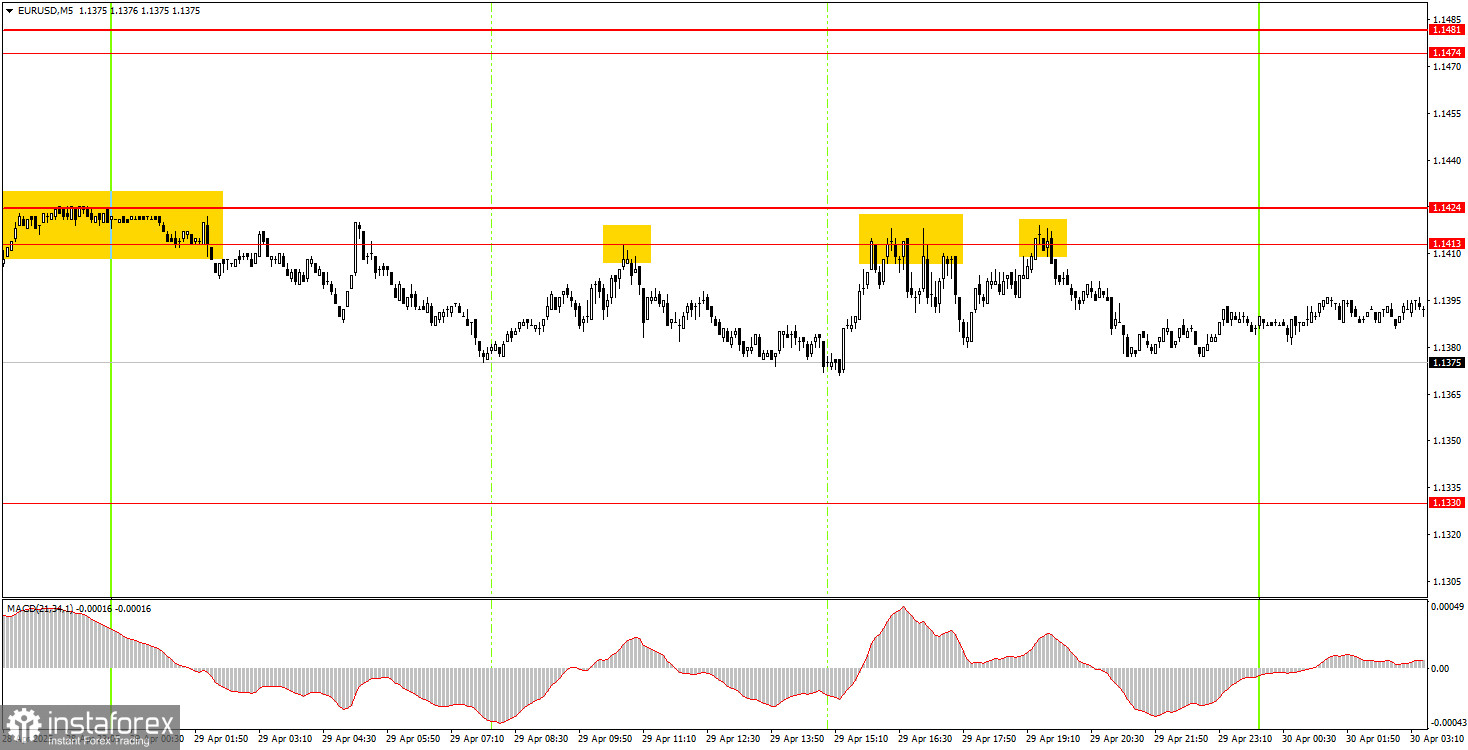
On Tuesday, three identical trading signals were formed in the 5-minute timeframe. The price bounced off the 1.1413–1.1424 zone three times, but volatility was weak, so each time, the price moved about 30 pips in the intended direction before returning to its original level.
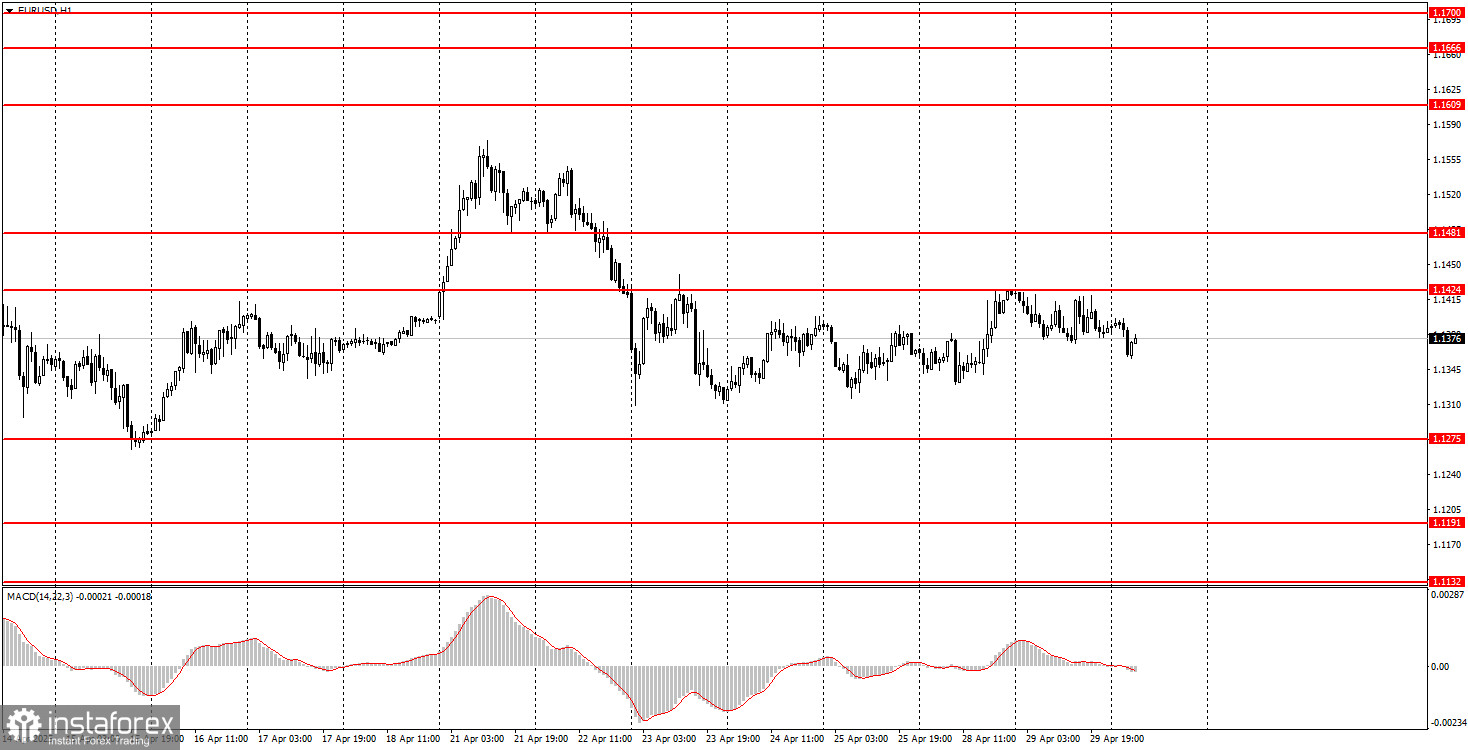
On the hourly timeframe, EUR/USD maintains a bullish trend. However, if we exclude the movements from the beginning of last week, the market has been flat for three weeks. Overall, market sentiment remains extremely negative toward the U.S. dollar and all things American. Still, if Trump shifts toward de-escalating the very trade conflict he initiated, the dollar could improve its position. Whether that will happen—or when—remains unknown.
On Wednesday, the pair may again move in either direction, as market movements depend entirely on Trump's statements and decisions. We believe the flat phase will continue for a while longer.
On the 5-minute timeframe, the key levels to watch are: 1.0940–1.0952, 1.1011, 1.1091, 1.1132–1.1140, 1.1189–1.1191, 1.1275–1.1292, 1.1330, 1.1413–1.1424, 1.1474–1.1481, 1.1513, 1.1548, 1.1571, 1.1607–1.1622, 1.1666, 1.1689. On Wednesday, the Eurozone is scheduled to release a considerable amount of macroeconomic data, including German retail sales, unemployment, inflation, and GDP, as well as Eurozone GDP. In the U.S., we'll see GDP and ADP reports. These are significant releases, but we strongly doubt that the market will pay attention to macroeconomic data today.
Support and Resistance Levels: These are target levels for opening or closing positions and can also serve as points for placing Take Profit orders.
Red Lines: Channels or trendlines indicating the current trend and the preferred direction for trading.
MACD Indicator (14,22,3): A histogram and signal line used as a supplementary source of trading signals.
Important Events and Reports: Found in the economic calendar, these can heavily influence price movements. Exercise caution or exit the market during their release to avoid sharp reversals.
Forex trading beginners should remember that not every trade will be profitable. Developing a clear strategy and practicing proper money management are essential for long-term trading success.
InstaForex analytical reviews will make you fully aware of market trends! Being an InstaForex client, you are provided with a large number of free services for efficient trading.


