 Stay
Stay 
Trading Conditions
Products
Tools


On Tuesday, the EUR/USD currency pair traded sideways, but it resumed its upward movement early Wednesday morning. This indicates that the ongoing uptrend, now in its fourth month and driven solely by Donald Trump's new trade policy, persists. The market took a one-month pause to correct the dollar as much as possible and now appears ready to resume selling the U.S. currency with renewed vigor.
On Monday, the reasons for selling the dollar were rather superficial. In simple terms, such reasons can be found daily. The market continues to use any information against the U.S. currency because it still wants nothing to do with it due to the U.S. president. In fact, this is precisely what Donald Trump is aiming for—he does not want a strong dollar. The U.S. currency had been appreciating against its peers for 16 years. There were no genuine reasons to sell the dollar on Tuesday and Wednesday.
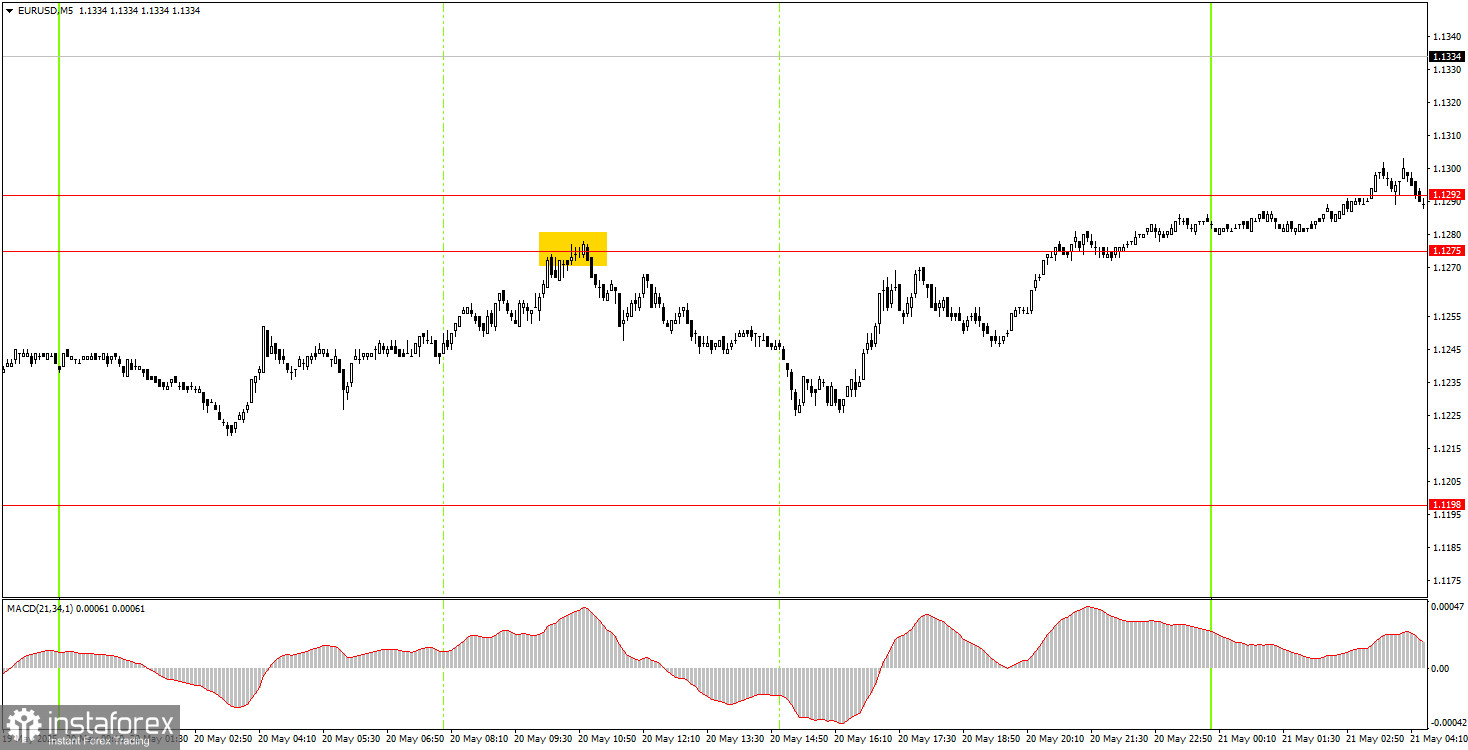
On the 5-minute timeframe on Tuesday, one decent trading signal was formed near the 1.1275–1.1292 zone. The price rebounded from that area and managed to fall about 40 pips. Unfortunately, the pair didn't reach the nearest target level, so any profit from the trade could only have been realized via manual closing. Overnight, the price consolidated above the 1.1275–1.1292 area. Those trading during the Asian session had the opportunity to enter long positions.
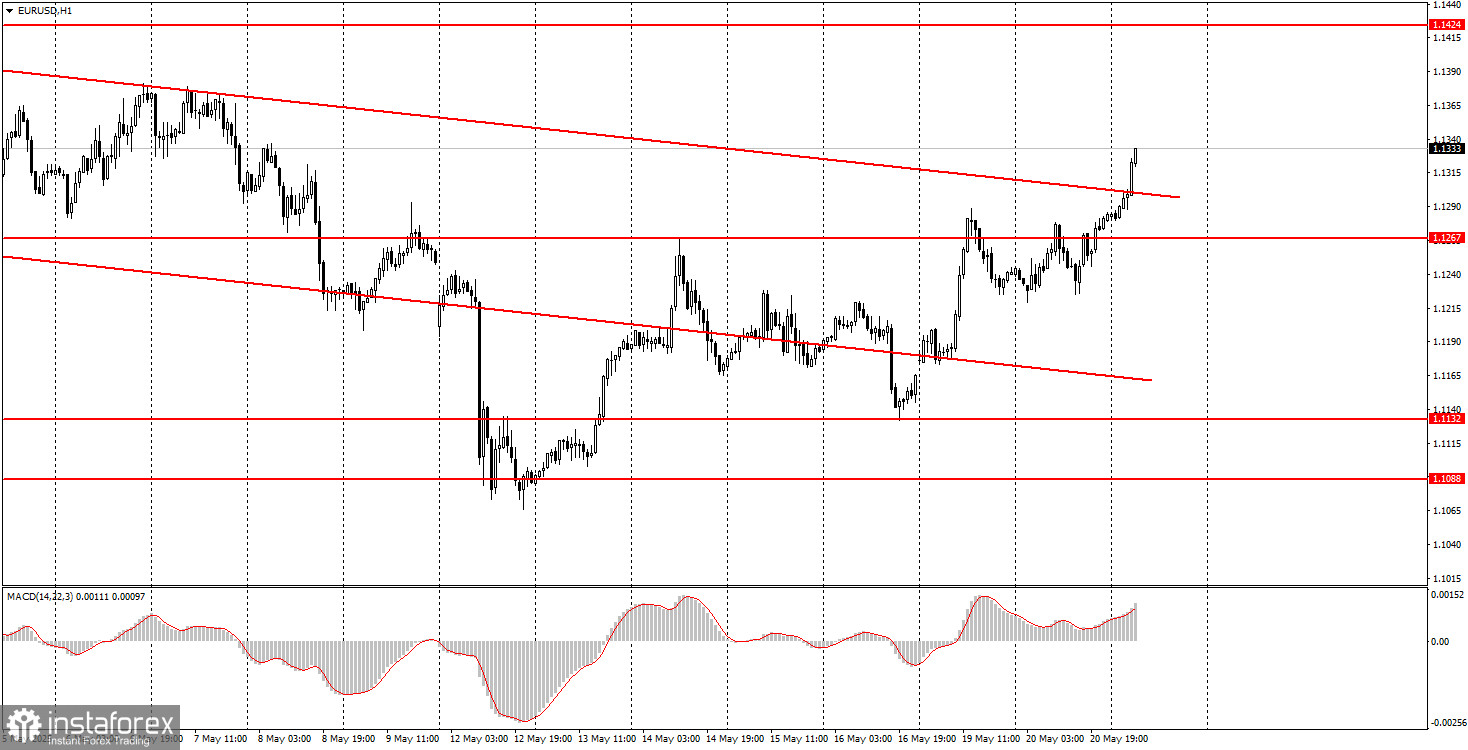
In the hourly timeframe, the EUR/USD pair broke above the descending channel and rose without apparent reason. It seems the upward trend that started when Trump became president appears to be continuing. This time, the market didn't even need new tariffs, sanctions, or other high-impact decisions from Trump. Given current circumstances, the mere fact that Trump is president of the U.S. is enough reason for traders to sell the dollar.
On Wednesday, EUR/USD will continue to trade based on technical factors. The macroeconomic backdrop still does not influence price movement, and the market is once again willing to sell the dollar for any reason—or none at all.
On the 5-minute chart, we should consider the levels of 1.0940-1.0952, 1.1011, 1.1088, 1.1132-1.1140, 1.1198, 1.1275-1.1292, 1.1413-1.1424, 1.1474-1.1481, 1.1513, 1.1548, 1.1571, 1.1607-1.1622. No significant events are scheduled in the eurozone or the U.S. on Wednesday. Intraday flat movement is possible, but current price action suggests the market has begun a new wave of dollar selling.
Support and Resistance Levels: These are target levels for opening or closing positions and can also serve as points for placing Take Profit orders.
Red Lines: Channels or trendlines indicating the current trend and the preferred direction for trading.
MACD Indicator (14,22,3): A histogram and signal line used as a supplementary source of trading signals.
Important Events and Reports: Found in the economic calendar, these can heavily influence price movements. Exercise caution or exit the market during their release to avoid sharp reversals.
Forex trading beginners should remember that not every trade will be profitable. Developing a clear strategy and practicing proper money management are essential for long-term trading success.
InstaForex analytical reviews will make you fully aware of market trends! Being an InstaForex client, you are provided with a large number of free services for efficient trading.


